PN-III-P1-1.1-PD-2016-0121
Contract 14 din 02/05/2018
Implementation period:
May 2018 – April 2020
Abstract
Advanced chemometric methods applied in plant metabolomics in water stress
Water stress is one of the major environmental factors that affects quality and crop production worldwide due to the lack of water or on the other hand, to the seasonal waterlogging or submergence stress (floods, hypoxic stress). Both of these water-related risks have enormous worldwide economic impact due to climate change, therefore, investigation of plants ability to resist in such stress is of great economic value. The profound understanding at the biochemical and molecular level in water stress are far from being explained and such understanding is crucial. Nonsymbiotic plant hemoglobins (nsHbs) are thought to be involved in many sorts of stress regulation, especially hypoxic response from the flooding stress via the NO dioxygenase activity, however, drought stress could also be envisaged to be regulated, at least in part by nsHbs. This proposal aims to track the metabolome in case of water stress and the involvement of nsHbs in plant adaptation and tolerance for these conditions using Arabidopsis thaliana as plant model and advanced chemometric methods. This direction, by the use of HPLC-MS, NMR analytical techniques and advanced multivariate chemometric methods as well as detection and characterization of metabolic by-products (ROS and RNS) using EPR techniques supports the biological relevance of the project. Comparison of the traditional chemometric methods in plant metabolomics with more performant methods of discrimination (fuzzified methods) in the light of their performances such as robustness, pattern recognition, outlier identification, in plant metabolomics is the analytical framework within these investigations are planned to be done.
Team members
- Lect. Dr. Augustin C. Mot – project director
- Prof. Dr. Costel Sarbu – mentor
Objectives and impact
Objectives:
- Characterization of the metabolome of A. thaliana in nsHbs modified lines (both mutants and overexpressing lines). This will imply a methodical use of HPLC-MS and NMR techniques and chemometric methods.
- Detection and characterization of metabolic by-products (such as ROS and RNS: hydrogen peroxide, superoxide and related species) of nsHbs (all three classes) modified plants in case of water stress, using EPR techniques and spin-traps and the involvement of the nsHbs.
- Comparison of the traditional chemometric methods in plant metabolomics with more performant methods of discrimination (fuzzy clustering, fuzzy principal component analysis, fuzzy-discriminant analysis), in the light of their performances such as robustness, pattern recognition, outlier identification in plant metabolomics.
Impact:
- Explaining in more detail and making predictions on the main plant metabolic pathways that are involved in water stress.
- Identifying the most important physiological roles involving nsHbs in water stress (including drought).
- Setting the concept of fuzzy robust methods in plant metabolomics in a more solid framework.
- Identifying novel biomarkers that may be used for monitoring and controlling water stress in plants.
- In the longer term, it is foreseen that the results provide novel occasions for rational crop plans to improve plant water stress tolerance with high economic and agricultural impact.
Budget
| Budget chapter (expenses) | 2018 (lei) | 2019 (lei) | 2020 (lei) | Total budget (lei) |
|---|---|---|---|---|
| Personnel | 41667 | 62500 | 20833 | 125000 |
| Logistics | 30797 | 37500 | 11051 | 79348 |
| Travel | 0 | 8695 | 4348 | 13043 |
| Indirect | 10870 | 16304 | 5435 | 32609 |
| Total | 83334 | 124999 | 41667 | 250000 |
Results and benefits
-
ISI published Articles
- A.D. Farcas, Augustin C. Mot*, C. Zagrean-Tuza, M. Ticolea, B. Sevastre, M. Kulak, R. Silaghi-Dumitrescu, A. Parvu, Remarkable rutin-rich Hypericum capitatum extract exhibits anti-inflammatory effects on turpentine oil-induced inflammation in rats, BMC Complementary and Alternative Medicine, 19 2019, 289. (IF 2.479)
- A.D. Farcas, Augustin C. Moț*, A. E. Pârvu, V. Toma, M. A. Popa, M.C. Mihai, B. Sevastre, I. Roman, L. Vlase, M. Pârvu, In Vivo Pharmacological and Anti-inflammatory Evaluation of Xerophyte Plantago sempervirens Crantz, Oxidative Medicine and Cellular Longevity, 13, 2019, 5049643. (IF 4.868)
- A. Guidea, C. Zagrean-Tuza, Augustin C. Mot*, C. Sarbu, Comprehensive evaluation of radical scavenging, reducing power and chelating capacity of free proteinogenic amino acids using spectroscopic assays and multivariate exploratory techniques, Spectrochimica Acta Part A-Molecular and Biomolecular Spectroscopy, 233, 2020, 118158. (IF 2.931)
- Augustin C. Mot*, C. Coman, N. Hadade, G. Damian, R. Silaghi-Dumitrescu, H. Heering, “Yellow” laccase from Sclerotinia sclerotiorum is a blue laccase that enhances its substrate affinity by forming a reversible tyrosyl-product adduct, PLOS One, 15, 2020, 0225530. (IF 2.776) *principal investigator, corresponding author
-
Conferences
- Augustin C. Mot, Galaba Naumova Letia, Cezara Cezara Zăgrean -Tuza, Kim Hebelstrup, Costel Sarbu, Chemometic methods applied in questing phytoglobins roles in plant stress conditions, Molecular Modeling in Chemistry and Biochemistry Conference – MolMod, Cluj-Napoca, 2018, Romania (Poster)
- Augustin C. Mot, Chemometric techniques applied in fast profiling of plants in abiotic stress, 46th International Conference of the Slovak Society of Chemical Engineering, 20-23 May 2019, Tatranske Matliare, Slovakia (Oral presentation)
- Augustin C. Mot, Cezara Zagrean-Tuza, Assessment of reaction intermediates in biomolecular systems using isotope exchange effect, 12th International Conference Processes in Isotopes and Molecules, 25-27 September 2019, Cluj-Napoca, Romania (Oral presentation)
-
Purchased equipments
- Nitrogen/argon steam sample contractor,
- thermomixer,
- vortex,
- magnetic stirrers
Scientific report
1. Water submergence treated Arabidopsis thaliana plants
The experiments started by generating water submergence stressed plants of wild type (Arabidopsis thaliana, Columbia 0), GLB1 and GLB2 knock-out mutants, and overexpressing GLB1 and GLB2 homozygous genetic lines, 20 individuals for each line and their corresponding controls. The stress has been set on 6 weeks old plants that have been grown in Plant Chamber (21°C, 65 % relative humidity, 100 mol m-2 s-1, cycle of 16 h light, 8 h night). The collected plants (Figure 1) have been flash freeze in liquid nitrogen and freeze-dried under vacuum. The dried plant material (about 6-8% in weight of fresh collected plant leaves) were sequentially extracted with chloroform and the remaining residue was further extracted with methanol. The methanol extracts were analysed using HPLC-DAD chromatographic system, monitoring the absorbance at 242 and at 280 nm. The chromatogram of some representative samples is illustrated in Figure 2. Principal Component Analysis was applied on the chromatographic data monitored at 280 nm (Figure 3). Significant differences were observed in both water submergence stress treated samples and between wild type and mutants. Similar results were obtained using cluster analysis (Figure 4).
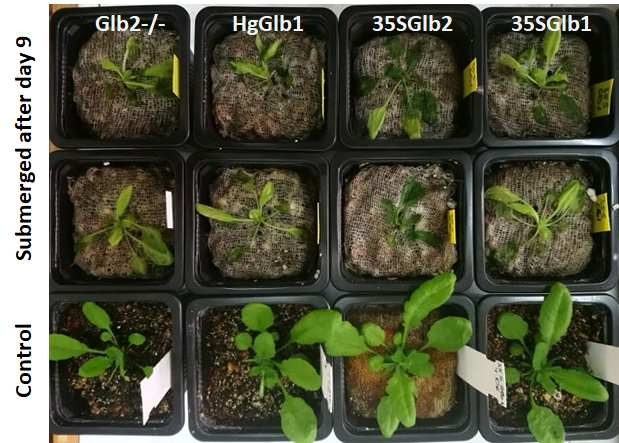
Figure 1.Some representative plants for each tested genetic lines after day 9th submergence and the control (untreated).
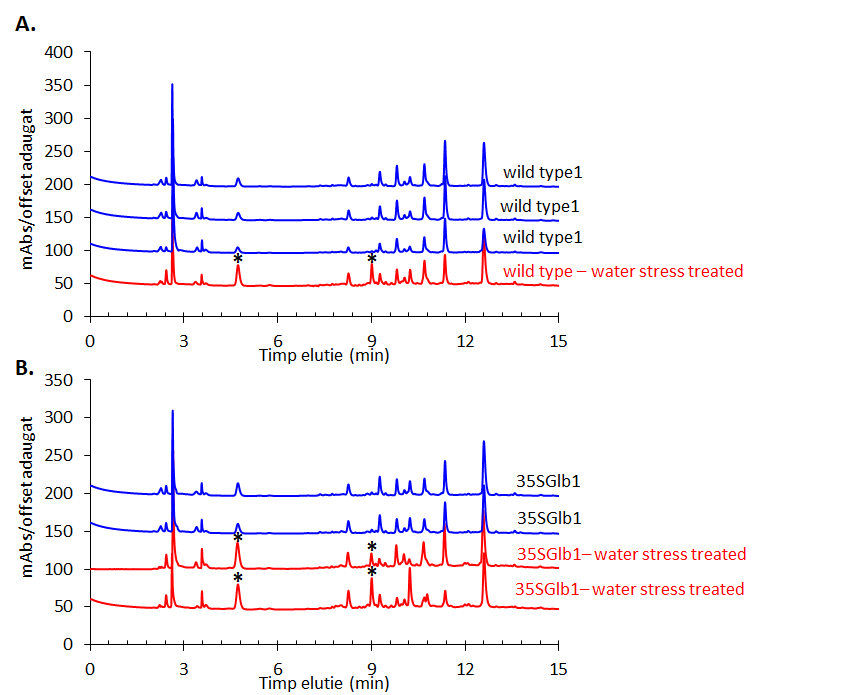
Figure 2.HPLC-DAD chromatogram of the methanolic extracts of the studied plants monitored at 280 nm. Metabolites that appear in higher amount in the treated samples than in the untreated ones are indicated using star (*).
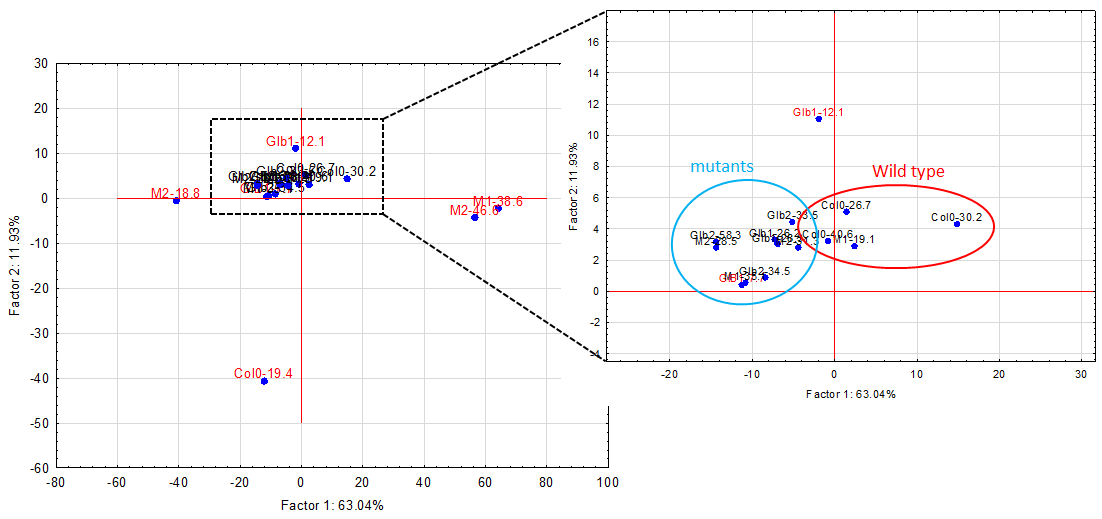
Figure 3.Principal component analysis (PCA) applied on the chromatograms from 242 nm.
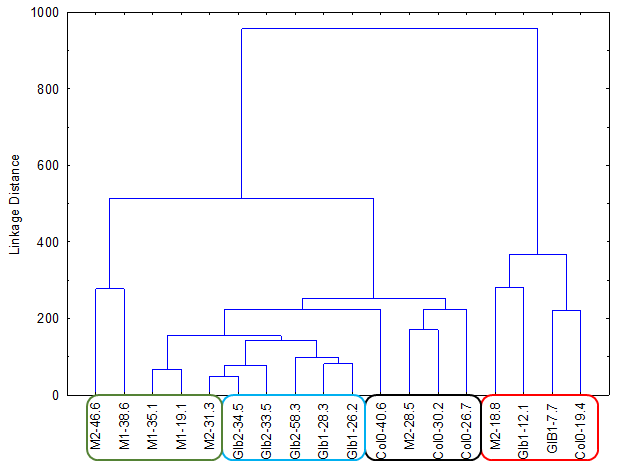
Figure 4.Cluster Analysis applied directly on 242 nm monitored chromatograms.
The chromatograms monitored at 242 nm reveal, besides the two metabolites at ca. 9 and 5 min as found by 280 nm chromatogram, a new one at ca. 7.5 minutes (Figure 5). A further aim will be to identify what is the nature of these compounds.The chromatographically analysed samples were also investigated for antioxidant activity evaluation using the ABTS radical bleaching assay (Figure 6). Water submergence treated samples have significantly lower antioxidant activity indicating that the water treatment induces oxidative stress that alter the redox balance status of the plants. In addition, some dried plant material was extracted using three other solvents: t-butyl-methyl-ether, methanol and isopropanol. The optimal solvent system used for extraction was determined by HPTLC chromatography (Figure 7). Chloroform appeared to be the best solvent for lipids extraction. The plate was eluted with petroleum ether/diethyl ether/formic acid, 7/3/0.6, v/v/v and detected with 10% CuSO4 (w/w) in 8% phosphoric acid (w/v) followed by incubation at 170 °C.
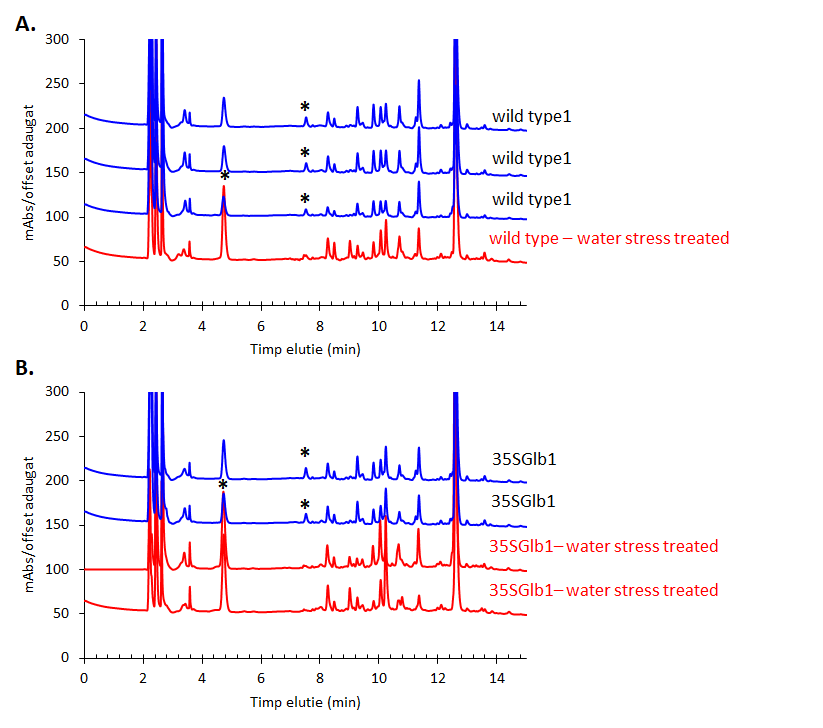
Figure 5.HPLC-DAD chromatogram of the methanolic extracts of the studied plants monitored at 242 nm. Metabolites that appear in higher amount in the treated samples than in the untreated ones are indicated using star (*).
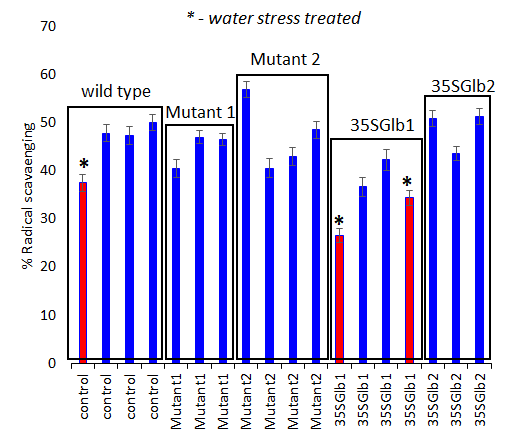
Figure 6.Antioxidant activity determination (using ABTS bleaching assay, 10 minutes’ reaction time) of the studied chromatographically analysed samples. Water submersed treated samples have significantly lower activity (red coloured).
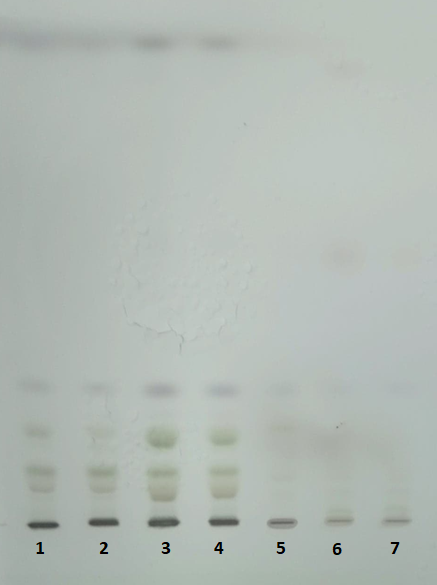
Figure 7.HPTLC plate (10 x 10 cm, Silicagel 60) after separation of the lipids extracted samples (wild type) using t-butyl-methyl ether (1,2), chloroform (3,4) and isopropanol (5,6,7).
2. NMR analysis of the water submerged Arabidopsis thaliana plants
The plants obtained after water submergence stress were freeze-dried and extracted with deuterated methanol (d6) and D2O (10%). The extracts were analysed using a 600 MHz 1H NMR spectrometer and the results are presented in Figures 8-13.
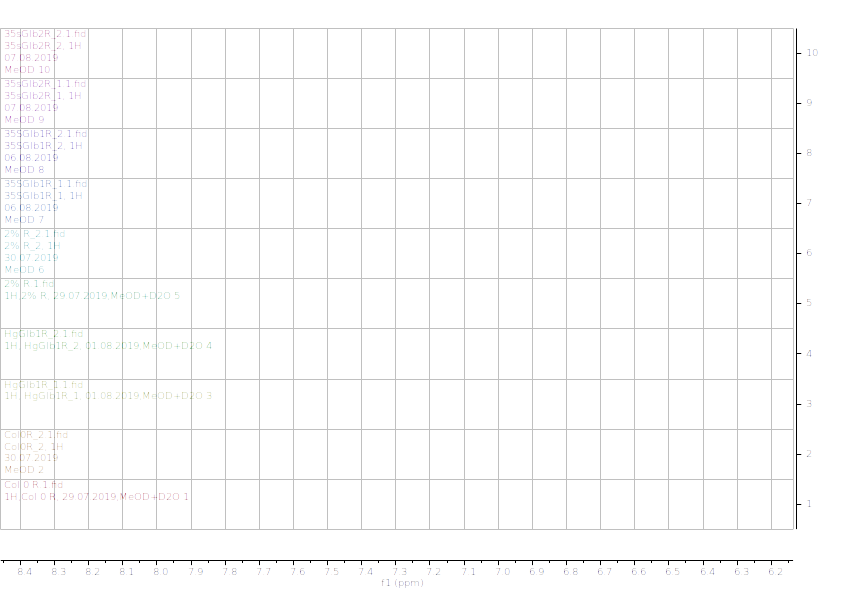
Figure 8.1H NMR (600 MHz) of the control unsubmerged A. thaliana extracts in deuterated methanol (6.2-8.4 ppm region). Col0- wild type, 35SGlb1,2-overexprising nsHbs, HgGlb1 and 2-/- are the two mutants for the nsHbs1 and 2, respectively.

Figure 9.1H NMR (600 MHz) of the control unsubmerged A. thaliana extracts in deuterated methanol (0.9-4.6 ppm region). Col0- wild type, 35SGlb1,2-overexprising nsHbs, HgGlb1 and 2-/- are the two mutants for the nsHbs1 and 2, respectively.
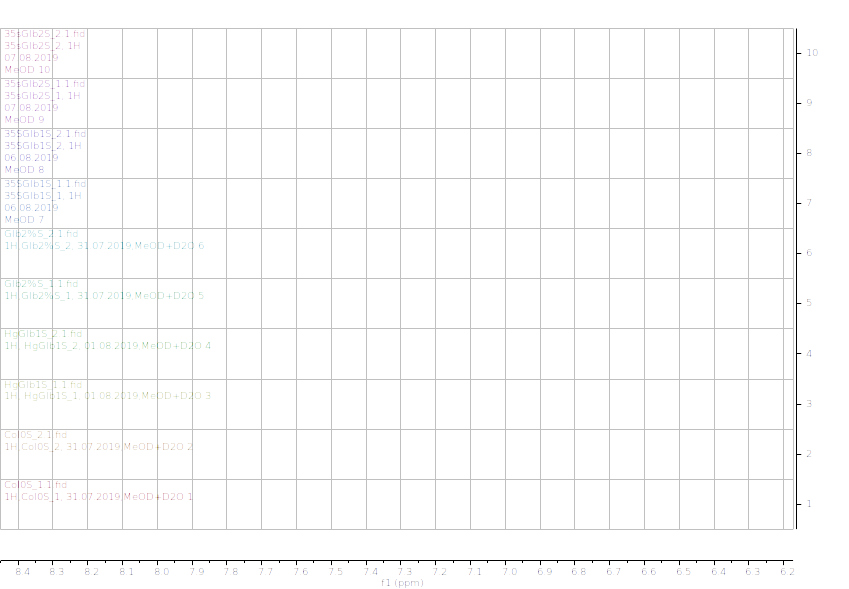
Figure 10.1H NMR (600 MHz) of the submerged A. thaliana extracts in deuterated methanol (6.2-8.4 ppm region). Col0- wild type, 35SGlb1,2-overexprising nsHbs, HgGlb1 and 2-/- are the two mutants for the nsHbs1 and 2, respectively.
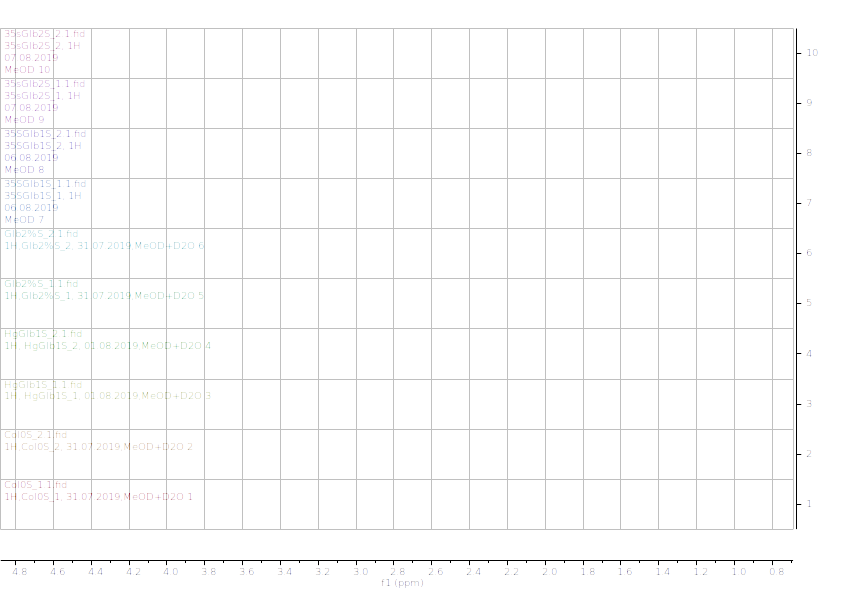
Figure 11.1H NMR (600 MHz) of the submerged A. thaliana extracts in deuterated methanol (0.9-4.6 ppm region). Col0- wild type, 35SGlb1,2-overexprising nsHbs, HgGlb1 and 2-/- are the two mutants for the nsHbs1 and 2, respectively.
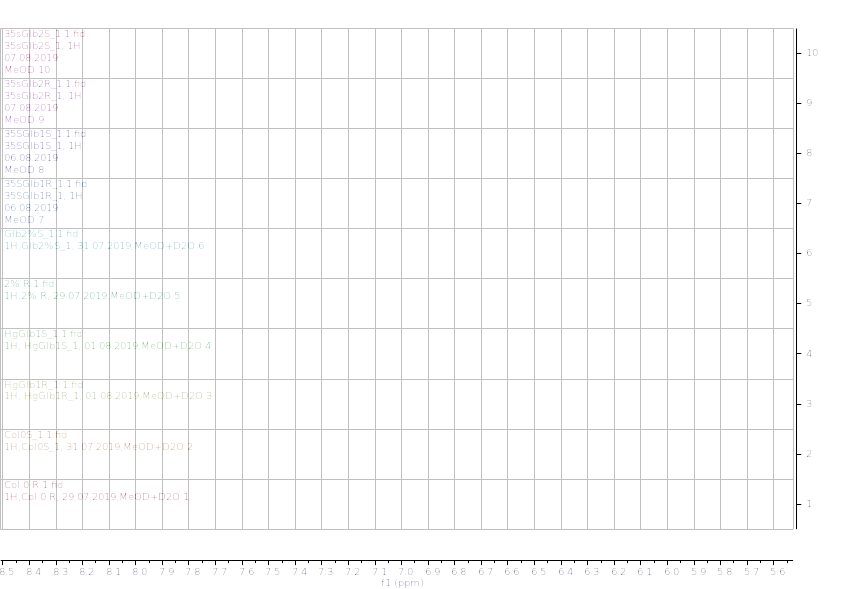
Figure 12.1H NMR (600 MHz) of the submerged vs. control (unsubmerged) A. thaliana extracts in deuterated methanol (5.6-8.4 ppm region). S – submerged, R- control. Col0- wild type, 35SGlb1,2-overexprising nsHbs, HgGlb1 and 2-/- are the two mutants for the nsHbs1 and 2, respectively.
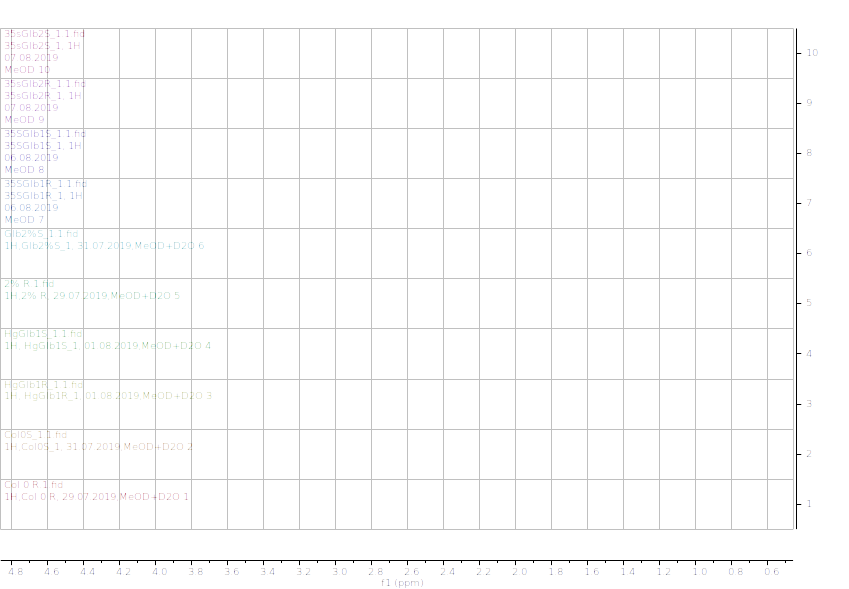
Figure 13.1H NMR (600 MHz) of the submerged vs. control (unsubmerged) A. thaliana extracts in deuterated methanol (5.6-8.4 ppm region). S – submerged, R- control. Col0- wild type, 35SGlb1,2-overexprising nsHbs, HgGlb1 and 2-/- are the two mutants for the nsHbs1 and 2, respectively.
As it can be easily noticed, the controls and the submerged extracts are well reproducible. It is very interesting that distinct modified peaks were identified in case of the submerged plants, suggesting important chemical compositions modification in case of water submergence (eg. 2.6 ppm, 4.4 ppm, etc.). In addition, this modification is well reproducible, again. Chemometric techniques will be applied on the digitized data in order to evaluate the significance of the two groups.
The water-deficit stress was set for Arabidopsis thaliana plants, and the plants are presented in Figure 14. As it can be noticed, a clear difference is observed between the studied genetic lines, indicating the importance role of the non-symbiotic plant haemoglobins that are played in this stress. The plant extracts will be analysed in order to identify the chemical constituents’ difference between the studied genetic lines.
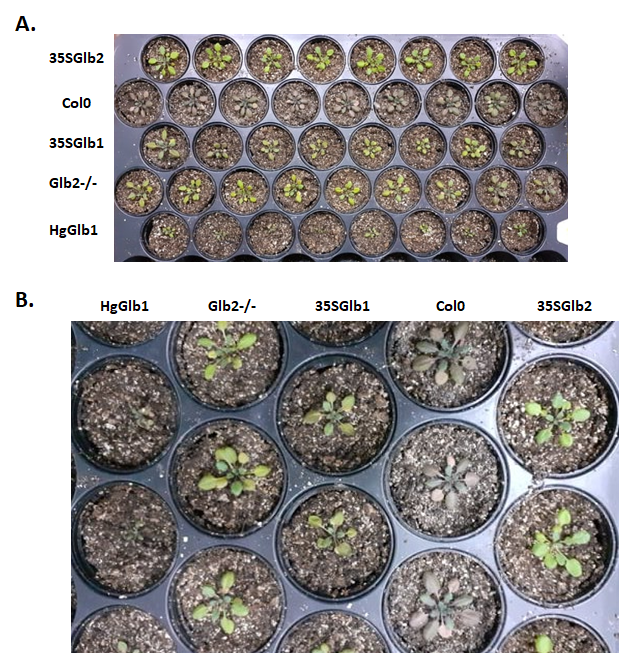
Figure 14.The water-deficit stress plants (after 9 days of stopping the watering of the plants) of the studied. Col0- wild type, 35SGlb1,2-overexprising nsHbs, HgGlb1 and 2-/- are the two mutants for the nsHbs1 and 2, respectively.
Phytochemical analysis by HPLC-MS and phytoconstituents profiling using EPR spectroscopy of a xerophyte plant species
For more practical reasons, a xerophyte plant species—a plant that is adapted to leave with very little water, in a desert-like region, Plantago sempervirens—was tested for phytochemical analysis, in contrast with other Plantago species from the same genus. It turned out that this species is by far more anti-inflammatory and antioxidant compare with its non-xerophyte counterparts. The results have been recently published in a complex study coordinated by the director of this project1.
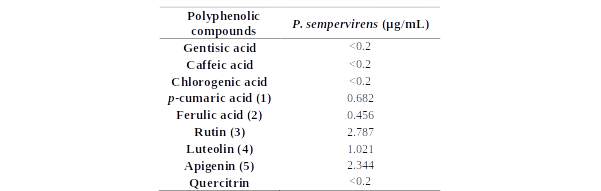
As shown in Table 1, Figures 15 and 16, chemical profile of P. sempervirens reveals the main compounds identified in each extract. By far, rutin, luteolin and apigenin were the main compounds in Plantago samples. Therefore, we found 1,021 μg/mL of luteolin; 6.48 ug/mL of apigenin and 2,34 μg/mL of rutin. P. sempervirens, by far was a rich extract because from the nine polyphenols quantified five were above the LOQ [apigenin (2,34 μg/mL), rutin (2,78 μg/mL), luteolin (1,02 μg/mL), acid ferulic (0,45 μg/mL) and acid p-coumaric acid (0,68 μg/mL)].
Table 1.The HPLC polyphenolic compounds content determination in the studied species (ug/mL extract)
In order to further analyse the major components from the chromatogram that were not identified in MS or based on retention time of the standards, UV-vis molecular spectra of these major chromatographic peaks (cca. 90% of total chromatographic area AU×min, for 280 nm chromatogram) were exported and analysed together with the spectra of twenty known standards using a chemometric approach. PCA analysis of the exported spectra reveals three distinct groups based on the three classes of polyphenols, i.e. benzoic acids, cinnamic acids and flavonoids, which are in general, the main phytoconstituents responsible for antioxidant activity in plant extracts (Figure 15A). Most of the tested compounds (cca. 80% of the chromatographic area, the four most intense peaks) are belonging to cinnamic acids group which present a distinct UV-vis spectrum profile. The assignments of each peak spectrum was also checked using the build-in soft (Agilent Chemstation) of the HPLC chromatograph using house-built-in data base of tens of polyphenolic standards. For this purpose, a score of spectral similarity higher than 90% for any compound (with a given standard) from those three classes was an indication that the tested compound does belong to a certain class. Spectral profiles of some representatives of these classes are shown in Figure 15B1. The HPLC results for the P. sempervirens extract is presented in Figure 16.
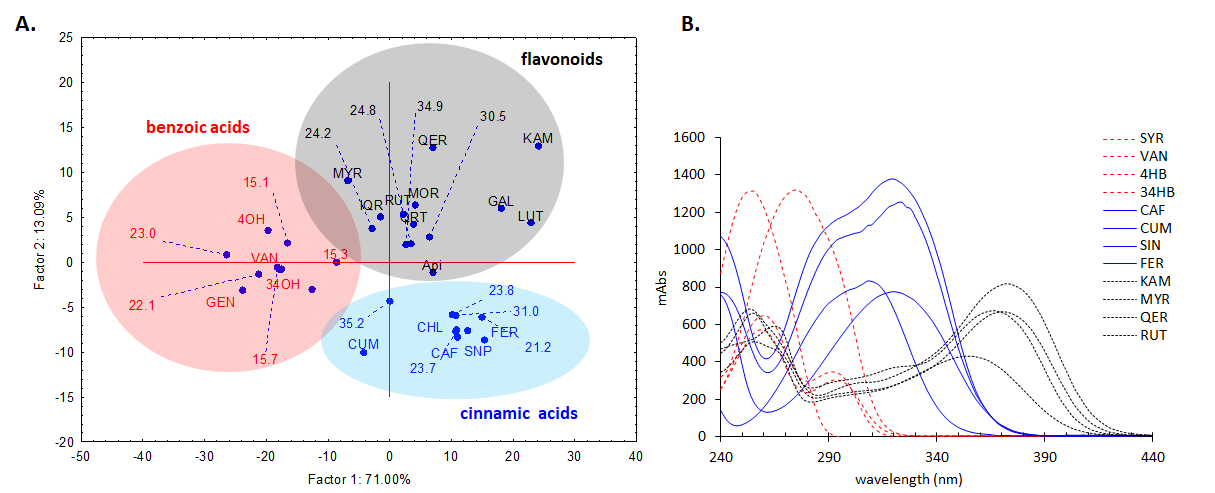
Figure 15.A. PCA analysis of the DAD UV-Vis molecular spectra of the main unidentified chromatographic peak from the Plantago sempervirens extract (indicated with their chromatographic elution time), together with the known standards, showing their grouping in three distinct classes of polyphenols, i.e. benzoic acids (red), cinnamic acids (blue) and flavonoids (black). Standards: 4OH-4-hidroxybenzoic acid, 34OH-3,4-dihydroxybenzoic acid, API-apigenin, CAF-cafeic acid, CHL-chlorogenic acid, FER-ferulic acid, GAL-galangin, GEN-gentisic acid, IQR-isoquercitrin, KAM-kaempferol, LUT-luteolin, MOR-morin, MYR-myricetin, CUM-p-coumaric acid, QER-quercetin, QRT-quercitrin, RUT-rutin, SNP-sinapic acid, SYR-syringic acid, VAN-vanilic acid B. Molecular DAD UV-vis spectra of some representative standard compounds from the three polyphenolic classes
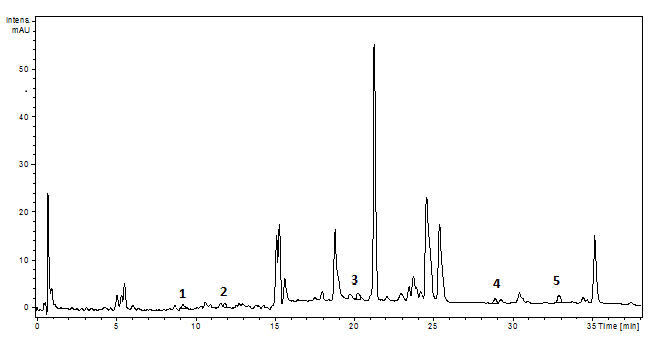
Figure 16.The HPLC chromatogram of the P. sempervirens extract (1-p coumaric acid, 2- ferulic acid, 3- rutin, 4- luteolin, 5- apigenin)1
Semiquinone anion radical generated fingerprint was detected using EPR measurements. As seen in Figure 17, there have been four different samples dilutions (S10, S50, S100 and S250), in order to have a clear picture about the spectra of some classes of compounds and their reactivity and chemical cross-talk of the semiquinone radicals which is concentration dependent. Luteolin, rutin and chlorogenic acid were some of the main compounds of interest. Apigenin, an important component in all samples does not generate radicals, most probably due to the lack of the catechol group in the B flavonoid ring. The spectra profile was strongly influenced by the dilution, thus 250x revealed similar shapes both for luteolin and chlorogenic acid in all samples. In the case of P. sempervirens, at higher concentration dominated luteolin-based radicals whereas for lower concentrations, rutin and phenolic acids become dominated. Moreover, this extract is the only one that still present a well-defined spectrum even at 250x dilution of the original extract.
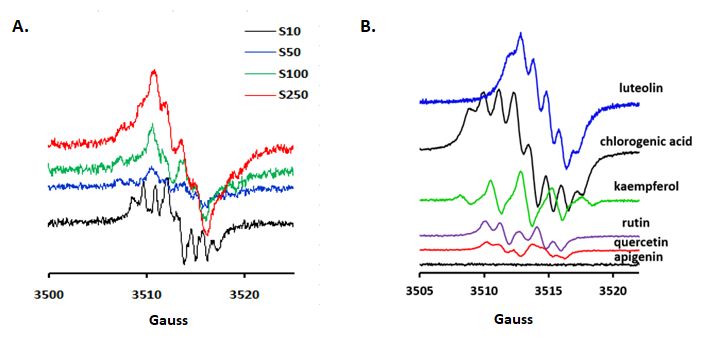
Figure 17.(A) P. sempervirens, using different dilutions of the original extract [10x (S10), 50x (S50), 100x (S100) and 250x (S250)]. Additionally, the spectral footprint of some constituents (luteolin, kaempferol, chlorogenic acid, rutin, quercetin and apigenin) (B)
4. Phytochemical analysis by means of chromatography and a plant species—Hypericum capitatum— from dried regions in comparison with Romanian Hypericum perforatum counterpart
The Hypericum capitatum, growing in a very dried region with very little water available during the year (in Turkey) was compared with Hypericum perforatum from Romania, in terms of phytochemical constituents. The study, including the anti-inflammatory tests was coordinated by the director of the project and was recently published
A high-performance thin-layer chromatography (HPTLC) analysis was performed in order to preliminary evaluate the profile of main secondary metabolite composition of each extract. It is considered that this fast-analytical method can quickly provide informative data regarding the main composition concerned with polyphenols, phenylpropanes and eventually other compounds of the H. capitatum. The compounds were firstly identified by their retention factor (Rf) and then on their fluorescence color. In addition to the H. capitatum extracts, a mixture of standards including rutin, chlorogenic acid, isoquercitrin, hyperoside, hypericin, kaempferol and quercetin was also analyzed. These compounds were previously reported in other members of Hypericaceae family. A sample from a representative of the same family, the well-known H. perforatum (St. John’s wort), was also included in HPTLC analysis to offer a reliable comparison agent for the studied plant. HPTLC results are shown in Figure 18
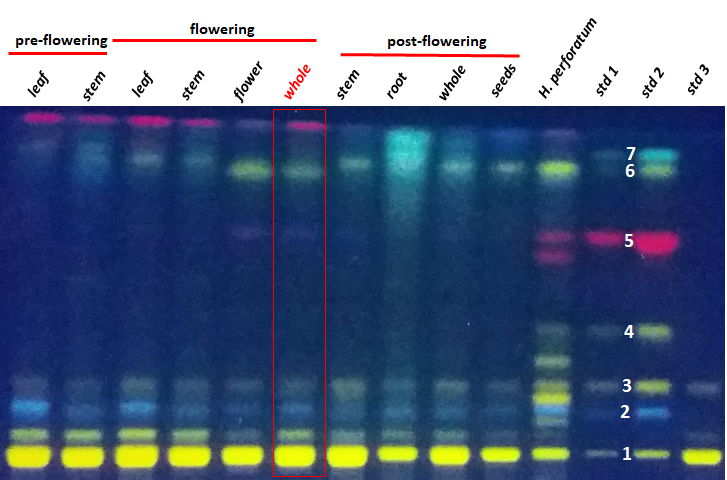
Figure 18.HPTLC analysis results indicating the main secondary metabolites contained by Hypericum capitatum extracts (each lane contains 8 µL of 10 mg/mL). Std1 – 2 µL and std 2 – 10 µL of standards mixture containing rutin (1 – Rf = 0.07), chlorogenic acid (2 – Rf = 0.18), isoquercitrin (3 – Rf = 0.26), hyperoside (4 – Rf = 0.41), hypericin (5 – Rf = 0.67), quercetin (6 – Rf = 0.86) and kaempferol (7 – Rf = 0.89), all at 100 µg/mL. Std3 - standard of rutin solution – 2 µL from 3.5 mg/mL
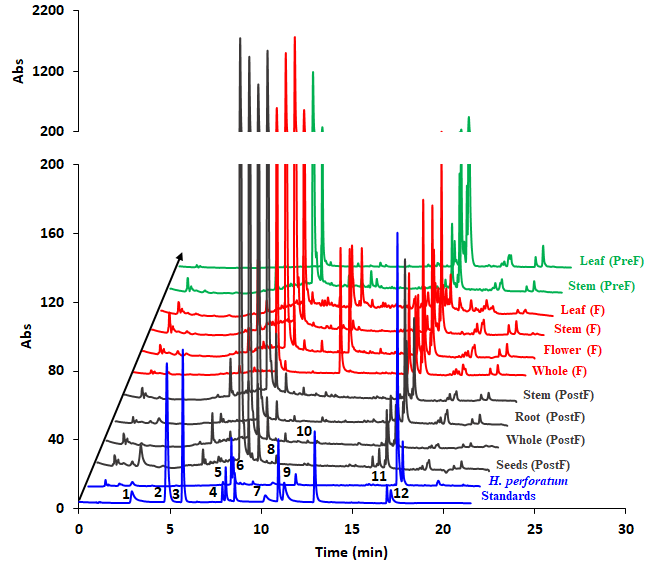
Figure 19.HPLC profiles of the studied H. capitatum extracts. Standards: 1 – chlorogenic acid, 2 – p-coumaric acid, 3 – caffeic acid, 4 – rutin, 5- isoquercitrin, 6 – quercitrin, 7 – quercetin, 8 – apigenin, 9 – kaempferol, 10 – chrysin, 11 – hyperforin, 11 – hypericin. By far, the highest chromatographic peak is rutin which accounts more than 70% peak area, in all cases. The y axis is rescaled and adapted for clarity.
In addition to the HPTLC analysis, a further HPLC analysis was also run. The chromatograms are arranged in Figure 19. The EPR spectra of the 10 extracts are shown in Figure 20. Besides, spectra of four representative standards were measured - namely rutin, isoquercitrin, cholorogenic acid and kaempferol, due to the fact that phytochemical analysis revealed their presence in considerable concentrations.
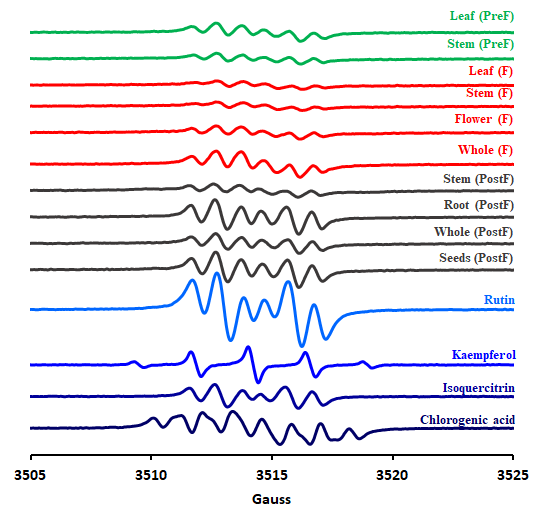
Figure 20. EPR spectra of all ten studied extracts of H. capitatum and four most representative standards.
5. Chemometric evaluation of in vitro biological properties of some wide-spread metabolites (amino acids)
Following the in vitro measurements of the radical scavenging, reducing power and chelating capacity of free proteinogenic amino acids using spectroscopic assays and multivariate exploratory techniques, the amino acids—which are one of the most important class of metabolites—were classified using different approaches3 (Figure 21). In most of the assays, the highest antioxidant activity is rendered by Cys and Trp, known for their involvement in physiological radical reactions, followed by Tyr, Asn and Arg. The least reactive amino acids with respect to both radical scavenging and reducing power principle were Ala, Met, Thr and Val. The hierarchy of the amino acids based on their antioxidant activity is shifting, depending on the analytical assay employed. Results from the multivariate exploratory techniques-hierarchical cluster analysis and principal component analysis-could point out the methods that are most similar and best connected to each other, thus classifying the investigated amino acids according to their activity. Considering the results of chemometric techniques, the antioxidant methods that best discriminate between amino acids are DPPH bleaching and SORS assays. All these findings are extensively described in one of the paper published within the framework of this project
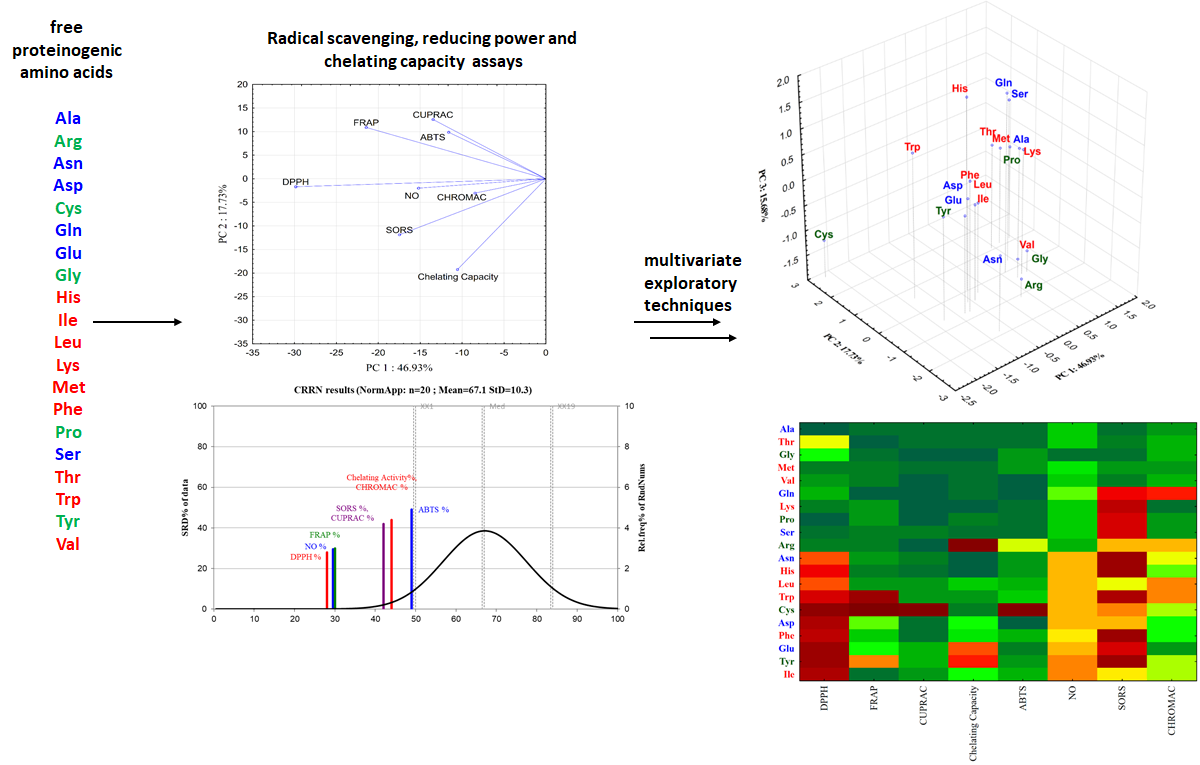
Figure 21. Analytical steps for the chemometric approach of the free proteinogenic amino acids in vitro biological properties analysis..
References
- A. D. Farcaș, A. C. Moț, A. E. Pârvu, V. A. Toma, M. A. Popa, M. C. Mihai, B. Sevastre, I. Roman, L. Vlase and M. Pârvu, Oxid. Med. Cell. Longev., 2019, 2019, 5049643
- A. D. Farcas, A. C. Mot, C. Zagrean-Tuza, M. Ticolea, B. Sevastre, M. Kulak, R. Silaghi-Dumitrescu and A. Parvu, BMC Complement. Altern. Med., 2019, 19, 289.
- A. Guidea, C. Zăgrean-Tuza, A. C. Moț and C. Sârbu, Spectrochim. Acta - Part A Mol. Biomol. Spectrosc., 2020, 233, 118158
Cluj-Napoca, April 2020,
Lect. Dr. Augustin C. Mot