PN-II-RU-TE-2014-4-2555
Contract 221 from 01/10/2015
Implementation period:
October 2015 – September 2017
Abstract
Nonsymbiotic plant hemoglobins in stress related responses
The first plant hemoglobins that were discovered were leghemoglobins which are highly expressed in the root nodules of legumes. Nonsymbiotic hemoglobins possess distinct nucleotide sequences and biochemical properties compared to them. Whereas leghemoglobins are nowadays well known both structurally and functionally, the function and mechanism of action of nonsymbiotic hemoglobins is still unclear. The main role of nonsymbiotic hemoglobins was attributed to NO scavenging and thus increasing plant survival during hypoxia. The current project aims to track the mechanism which governs nonsymbiotic hemoglobins involvement in plant stress tolerance using Arabidopsis thaliana and Medicago truncatula as plant models. This will involve transgenic lines of A. thaliana and M. truncatula and will lead to the identification of the nonsymbiotic hemoglobins’ physiological roles in plant-pathogen interaction and in tolerance of other abiotic stress factors. Additionally, in vitro biochemical characterization of two previously unexplored truncated nonsymbiotic hemoglobins from M. truncatula will be performed. The outcome of the current project is expected to lead to solid explanations and predictions on the enzymatic activities of the nonsymbiotic hemoglobins in plants. In the longer term, it is foreseen that the results provide novel occasions for rational crop plans design to improve plant stress tolerance.
Team members
- Dr. Augustin C. Mot – project director
- Dr. Cristina Bischin – research assistant
- PhD student Cristina Mircea – research assistant
- PhD student Anca D. Farcas – research assistant
- Chim. Galaba Naumova-Letia – chemist
Objectives and impact
Objectives:
- In vitro biochemical characterization of two previously unexplored truncated nsHbs from Medicago. This will imply isolation, purification, spectroscopic investigations (UV-vis, EPR, FTIR, CD) upon their deoxy, oxy and met forms and their interaction with putative interaction small molecules (O2, CO, CN-, N3-, NO, NO2, H2O2, S22-, SO32- - including kinetics taking advantage of stopped-flow, freeze quench and/or flash photolysis techniques), ligand binding affinities (O2, NO, CO).
- In vitro characterization of their putative enzymatic activities (enzymatic parameters, kinetics, inhibitory study) in comparison with the activities of the three nsHbs from Arabidopsis.
- Obtaining and characterization of stable transgenic nsHb overexpressing lines of Arabidopsis thaliana and transient root transformed Medicago truncatula plants and obtaining of nsHbs knock-out mutants (by screening of Tnt1 insertion lines).
- Identification and, if identified, characterization of a metHb reductase as a putative in vivo partner in nsHbs enzymatic activities.
- Identification of nsHbs physiological roles in S. sclerotiorum – Arabidopsis and Medicago interaction.
- Identification of nsHbs physiological roles in tolerance of abiotic stress factors in Arabidopsis and Medicago.
Impact:
- Explaining and making predictions on the catalytic activities of the nsHbs in plants that are currently unclear or unexplored.
- Identifying of new physiological roles in different pathways involving nsHbs
- In the longer term, it is foreseen that the results provide novel occasions for rational crop plans to improve plant stress tolerance.
- Identifying novel biomarkers that may be used for monitoring and controlling water stress in plants.
- A welcome opportunity to train a passionate group of young researchers (PhD students, postdocs) and undergraduate students.
Budget
| Budget chapter (expenses) | 2015 (lei) | 2016 (lei) | 2017 (lei) | Total budget (lei) |
|---|---|---|---|---|
| Personnel | 40000 | 141250 | 100675 | 281925 |
| Logistics | 3470.11 | 96521.60 | 79378.93 | 179370.64 |
| Travel | 0 | 10665.88 | 6290.41 | 16956.29 |
| Indirect | 6520.52 | 37265.62 | 27951.66 | 71737.80 |
| Total | 49990.63 | 285703.10 | 214296.00 | 549989.73 |
Results and benefits
-
Articles
- Mioto Paulo Tamaso, Ruiz Marta Rodríguez, Augustin C. Mot, Corpas Francisco J., Freschi Luciano, Mercier Helenice, Alternative fluorimetric-based method to detect and compare total S-nitrosothiols in plants, Nitric oxide – Biology and Chemistry, 68, 2017, 7-13 http://www.sciencedirect.com/science/article/pii/S1089860316302221
- Naumova-Letia Galaba, Mot Augustin-Catalin, Probing reducing power for ferryl phytoglobins of several phenolic compounds using their kinetic profiles assisted by chemometric methods, STUDIA UBB CHEMIA, LXII, 2, Tom I, 2017, 9-66;http://chem.ubbcluj.ro/~studiachemia/issues/chemia2017_2/tom1/05Letia_Mot_49_66.pdf
- Mot Augustin-Catalin, Parvu Marcel, Parvu Alina, Rosca-Casian Oana, Dina Nicoleta, Leopold Nicolae, Silaghi-Dumitrescu Radu, Mircea Cristina, Reversible naftifine-induced carotenoid depigmentation in Rhodotorula mucilaginosa (A. Jörg.) F.C. Harrison causing onychomycosis, Scientific Reports, 2017, 11;7(1):11125 https://www.ncbi.nlm.nih.gov/pmc/articles/PMC5593942/
- Christin Naumann, Augustin C. Mot, Nico Dissmeyer, Generation of artificial N-end rule substrate proteins in vivo and in vitro, Plant Proteostatis series, Methods in Molecular Biology, ed. Clifton, N.J., Volume: 1450, 201, 2017, pag. 55-83; https://link.springer.com/protocol/10.1007%2F978-1-4939-3759-2_6
- Augustin C. Mot, Erik Prell, Maria Klecker, Christin Naumann, Frederik Faden, Bernhard Westermann, Nico Dissmeyer, Real-time detection of N-end rule-mediated ubiquitination via fluorescently labeled substrate probes, New Phytologist, 2018, 217(2):613-624 https://www.ncbi.nlm.nih.gov/pmc/articles/PMC5763331/
- Miclea Patricia, Bischin Cristina-Maria, Naumova-Letia Galaba, Augustin C. Mot, Dorneanu Sorin, Dorina Podar, Nico Dissmeyer, Silaghi-Dumitrescu Radu, Redox control and autoxidation of class 1, 2 and 3 phytoglobins from Arabidopsis thaliana, Scientific Reports, 2018, 13714 https://www.nature.com/articles/s41598-018-31922-4
- Daniela Benedec, Ilioara Oniga, Daniela Hanganu, Ana Maria Gheldiu, Cristina Pușcaș, Radu Silaghi-Dumitrescu, Mihaela Duma, Brîndușa Tiperciuc, Rodica Vârban, Laurian Vlase, Sources for developing new medicinal products: biochemical investigations on alcoholic extracts obtained from aerial parts of some Romanian Amaryllidaceae species, BMC Complementary and Alternative Medicine, 2018; 18: 226.
- Anca D Farcas, Augustin C Mot, Cezara Zagrean-Tuza, Vlad Toma, Claudia Cimpoiu, Anamaria Hosu, Marcel Parvu, Ioana Roman, Radu Silaghi-Dumitrescu, Chemo-mapping and biochemical-modulatory and antioxidant/prooxidant effect of Galium verum extract during acute restraint and dark stress in female rats, PLOS One, 2018 https://journals.plos.org/plosone/article?id=10.1371/journal.pone.0200022
- Augustin C Mot, Cristina Puscas, Sorin Aurel Dorneanu, Radu Silaghi-Dumitrescu, EPR detection of sulfanyl radical during sulfhemoglobin formation–Influence of catalase, Free Radical Biology and Medicine, 2019, 110-115. https://www.sciencedirect.com/science/article/pii/S0891584919302631
-
Conferences (Oral presentations or posters):
- Augustin C. Mot, Cristina Bischin, Galaba Naumova Leția, Grigore Damian, Nicoleta Dina, Nicolae Leopold, Radu Silaghi-Dumitrescua, Spectroscopic characterization of nonsymbiotic plant hemoglobins using UV-vis, Raman and EPR techniques, National Conference of Biophysics, June 2016, Cluj-Napoca, Romania;
- Galaba Naumova Leția, Cristina Bischin, Augustin C. Mot, Grigore Damian, Nicolae Leopold, Nico Dissmeyer, Radu Silaghi-Dumitrescu, Mechanistic study of the reaction between nitrite and three distinct nsHbs from Arabidopsis thaliana by means of UV-Vis, Raman and EPR spectroscopy, 6th Plant Nitric Oxide International Meeting, Septembrie 2016, Granada, Spain
- Nicoleta E. Dina, Alia Colniță, Cristina Mircea, Augustin C. Moț, Nicolae Leopold, Marcel Parvu, Radu Silaghi-Dumitrescu, Resonant Raman investigation of the ROS generated stress interference with the carotenogenesis of R. mucilaginosa, 33rd European Congress on Molecular Spectroscopy (EUCMOS 2016), August 2016, Szeged, Hungary
- Cristina Bischin, Patricia Miclea, Galaba Naumova Leția, Augustin Moț, Grigore Damian, Radu Silaghi-Dumitrescu, Alternative path for controlling the oxidations state and oxidative stress of class 1, 2 and 3 from Arabidopsis thaliana, EuroBIC, August 2016, Budapesta, Hungary
- Galaba Naumova Leția, Augustin C. Mot, Cristina Bischin, Grigore Damian, Nico Dissmeyer, Radu Silaghi-Dumitrescu, In vitro evaluation of peroxidase activity in phytoglobins - a comparative study, XIX International Conference on Oxygen Binding and Sensing Proteins, September 2016, Hamburg, Germany
- Cezara Zăgrean-Tuza, Nico Dissmeyer, Augustin C. Moț, Structural and mechanistic characterization of key enzymes in Arabidopsis thaliana, N-term 2017 - Proteostasis via the N-terminus Conference, Halle (Saale), Germany
- Cezara Zăgrean-Tuza, Augustin C. Moț, Structural and mechanistic characterization of key enzymes in Arabidopsis thaliana, International Conference Students for Students, 2017, Cluj-Napoca
- Cezara Zăgrean-Tuza, Augustin C. Moț, Structural and mechanistic characterization of a new enzyme from Arabidopsis thaliana, 11th biennial International Conference on Processes in Isotopes and Molecules, 2017, Cluj-Napoca
- Cezara Zăgrean-Tuza, Augustin C. Moț, On finding the three hidden rings and their involvement in plant protein degradation, International Conference of Young Researchers in Sciences, 2017, Cluj-Napoca
- Anca D. Farcaș, Luiza Buimagă-Iarinca, Augustin C. Moț, Vlad Al. Toma1, Silvia Neamțu, Marcel Pârvu, Structure - biological activity relationship of estrogenic flavonoids from Plantago sempervirens, 19th IUPAB and 11th EBSA Congress, 2017, Edinburgh, Scotland
- Augustin C. Mot, Galaba Naumova Leția, Cezara Zăgrean-Tuza, Kim Hebelstrup, Costel Sarbu, Profiling non-symbiotic plant hemoglobins as regulators in oxidative and nitrosative stress: a chemometric approach, Euroanalysis, 2017, Stockholm, Sweden
-
Purchased equipments
- Plant Growth Chamber GC-300TL/ 300TLH, value: 44200 lei
- Fully equipped Biorad Electrophoresis and Western blotting system, value: 10116 lei
- Eppendorf microcentrifuge: 8740 lei
- Retsch Mixer Mill MM 400: 31200 lei
Scientific report
Introduction
Hemoglobins (Hbs) are a diverse family of proteins with various biological functions and are found in all kingdoms of life (animals, bacteria, algae and plants). Three types of non-symbiotic plant hemoglobins (nsHbs) have been identified based on their primary structure, oxygen affinity and structural aspects: class 1, class 2 and class 3 or truncated hemoglobin’s (trHb). The most recently discovered hemoglobin’s, the truncated hemoglobin’s (trHb), are nearly ubiquitous in the plant kingdom and are considered to be of ancient origin. They are phylogenetically distinct from their classical counterparts, smaller in size, have a compact ‘2-on-2’ structure and are pentacoordinated. So far, it has been proposed that their roles may be as oxygen sensors, as scavengers of oxygen and NO active species. Their different origin, biochemical characteristics and tertiary structure suggest that trHb have cellular functions different from the others nsHb.
Despite the widespread presence of the hemoglobin’s in the plant kingdom, their physiological role remains unclear and several functions are conceivable. It has been proposed that plant hemoglobin’s could be multifunctional proteins; their low in vivo concentrations may suggest that one of the functions could be related to pseudo-enzymatic activities, such as peroxidase activity.
Optimization of recombinant expression in E. coli of nonsymbiotic hemoglobins from Arabidopsis thaliana and Medicago truncatula
Optimal conditions for recombinant expression of the three nonsymbiotic hemoglobins (Hb) from Arabidopsis thaliana (AtHb1, AtHb2 and AtHb3) and the two truncated nonsymbiotic hemoglobins from Medicago truncatula; For this reason we investigated the influence of IPTG (inducer), cofactor (heme concentration) and time of expression using a partly factorial experimental design. For each of the five hemoglobins, we found the optimum conditions that were depicted in 3D plots as in Figure 1.
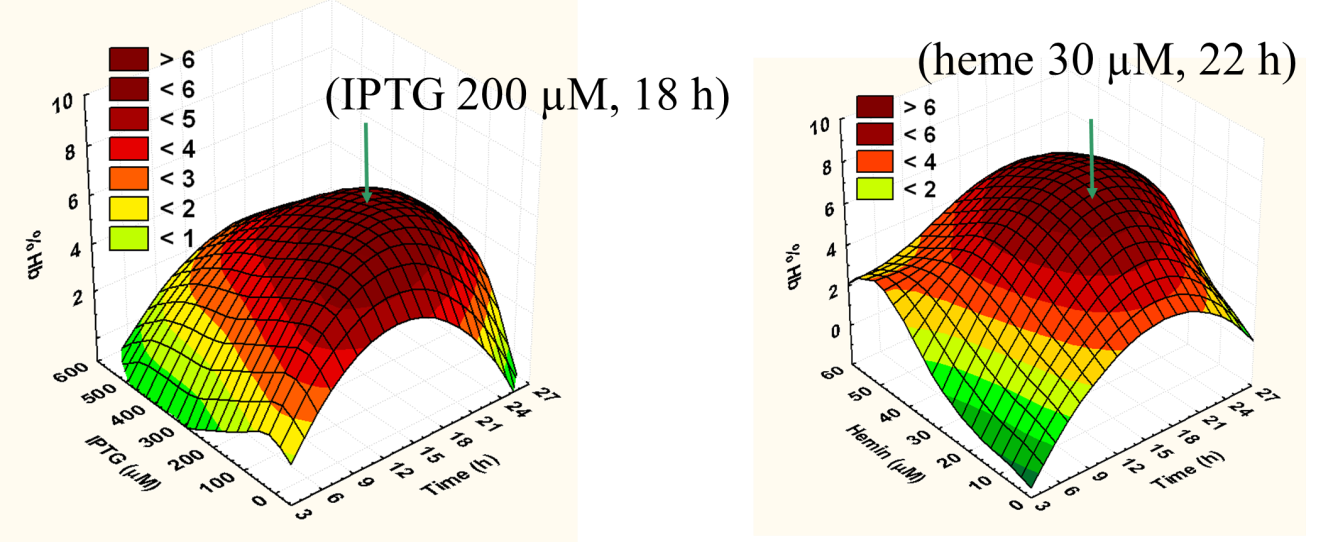
Figure 1. Typical 3D plots for optimum parameters determination regarding the expression condition of the five studied recombinant proteins (here for AtHb3).
Using the optimum condition, protocols for purification of the five recombinant hemoglobins were developed; this included NiNTA based affinity chromatography (all the cloned constructs were formed of Histag-MBP-TEV sequence-Hb), followed by amylose affinity chromatography and TEV protease cleavage of the MBP, MBP removal and final pure Hb production. The purification was monitored by SDS-PAGE (see Figure 2). The truncated proteins appeared to be much more difficult to purify that expected (due to its high reactivity and ROS generation during the purifications steps) and this was solved by the expression of the protein in presence of carbon monoxide and anion exchange chromatography (Figure 3). Currently we are finishing the protocols for the purification of the MtHb1 and MtHb2.
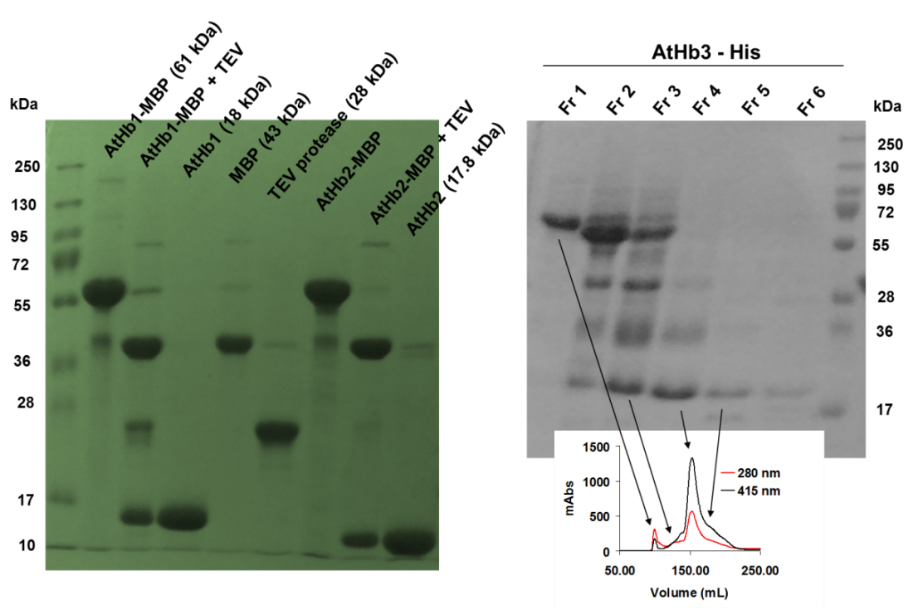
Figure 2.Monitorisation of isolation, cleavage and purification of final pure AtHbs from the fusion protein MBP-Hbs using SDS-PAGE (left panel) and sponatanious crosslinking of AtHb3-His as fractionasid using size exclusion chromatography (right panel).
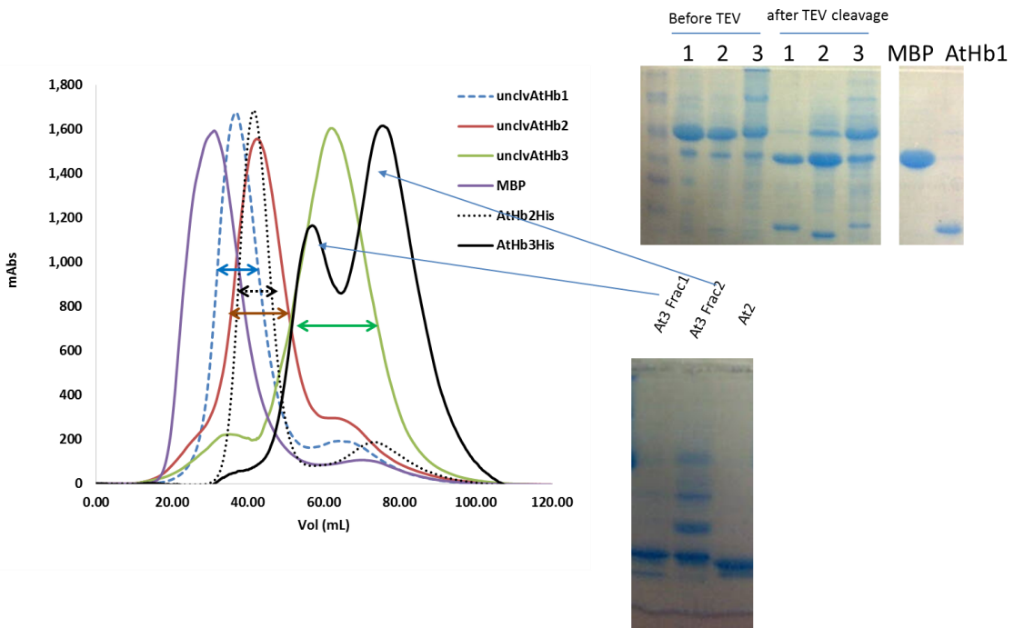
Figure 3. Anion exchange purification step for the AtHb3-His recombinant protein.
The Uv-vis spectra of purified hemoglobins were recorded and are under evaluation. The literature is not consistent for all three AtHbs regarding the extinction coefficient (except AtHb3), thus these spectral parameters were determined (Figure 4). These are very useful data that we need in our further investigation for protein concentration monitorization and species evaluation.
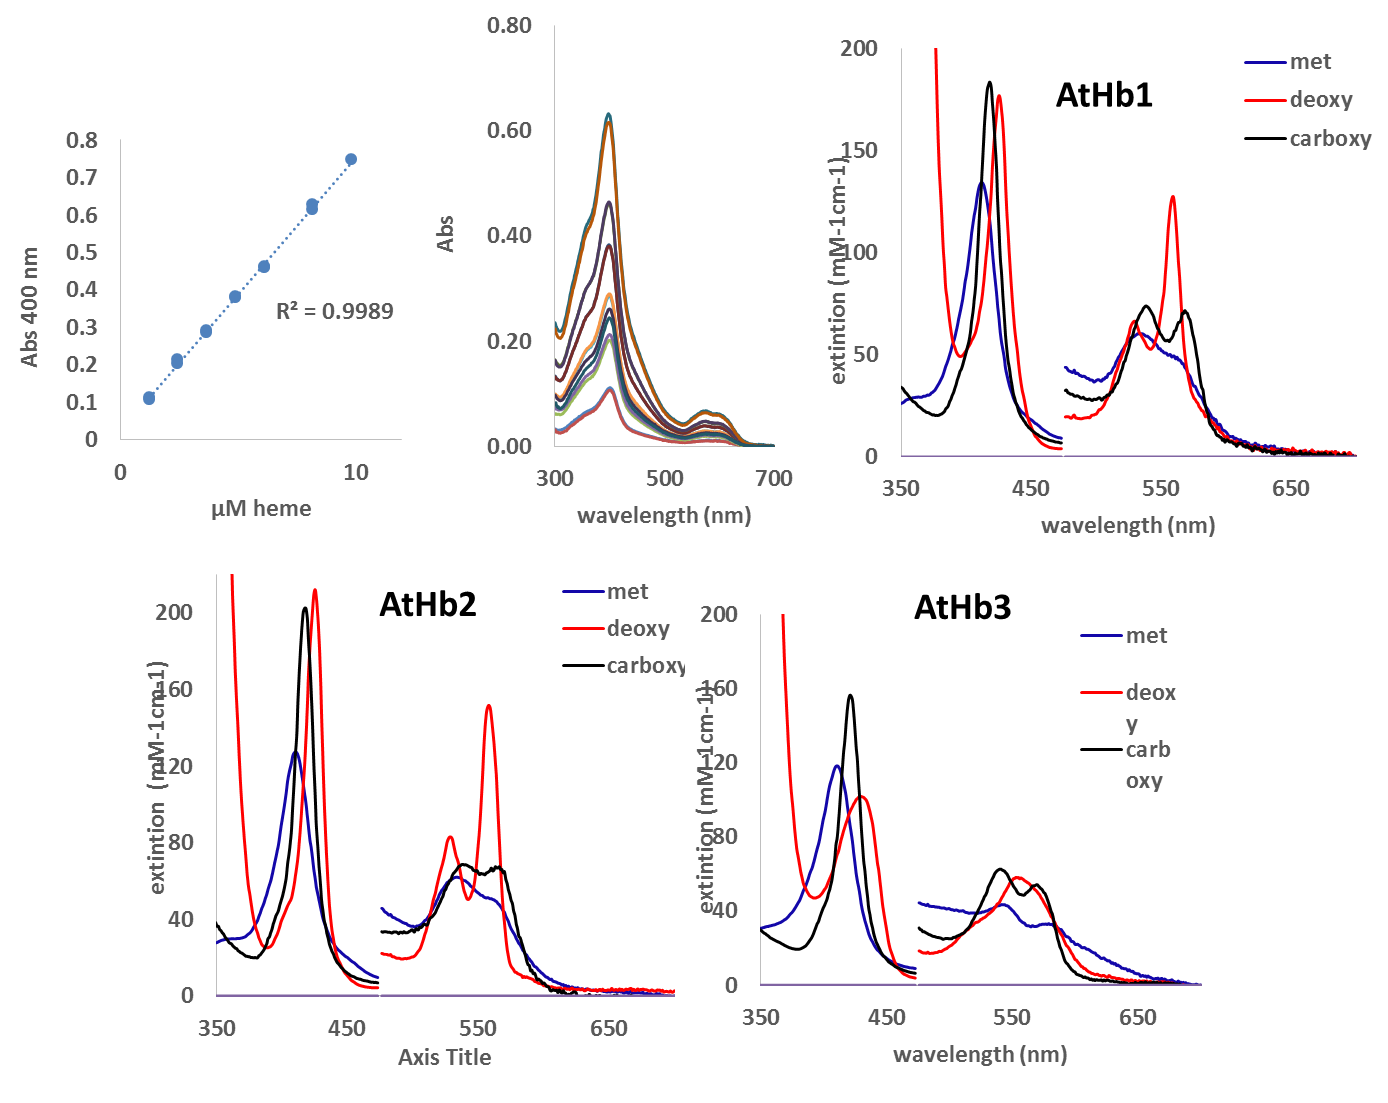
Figure 4.Extinction coefficient determination for the three AtHbs recombinant proteins for the three forms (met, deoxy and carboxy).
Additionally to the planned worked for this period, one of the team members started the EPR (Electron paramagnetic resonance) spectroscopy investigation of the proteins (Figure 4) and we foresee interesting results that will be published next year and will be a good contribution to the field.
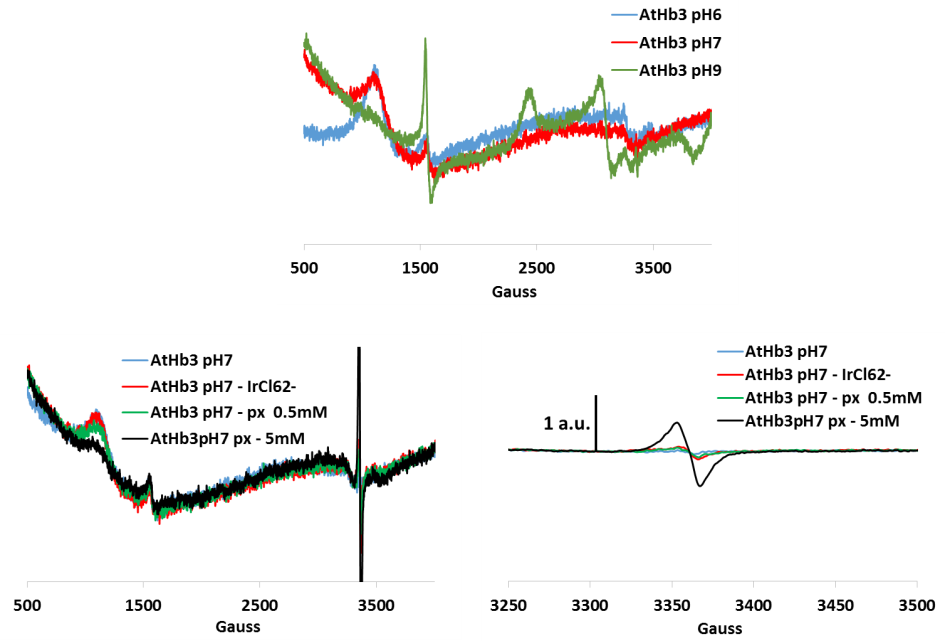
Figure 5.EPR spectrum for AtHb3 at three pH values and its treatment with hydrogen peroxide (px) and hexachloro potassium iridate (strong oxidants, to oxidize the iron to the ferryl species). Protein radical were identified (signal centered on 3350 Gauss)
During this time, we had in parallel, discussions with our collaborators from Leibniz Institute of Plant biochemistry, Halle, Germany and we established details about the vectors (type of promotors, etc.) in order to generate them (next months) for the transformation of the Arabidopsis thaliana overexpressing lines with these hemoglobins.
Determination of extension coefficient of tr.Hbs from Medicago trancatula
The extension coefficients of the Soret, α and β band of trHb, MtHb1 and MtHb2, were determined by UV-Vis spectroscopy using the method of quantification of the heme of Mb (2-12 μM) using 0.2M NaOH and 5% triton X-100 for realizing the heme in the solution (Figure 5) and creating the calibration curve.
Determination of pKa for MtHb1 and MtHb2
Determination of pKa for the met forms (Fe(III)-Hb) was performed for both trHb, MtHb1 and MtHb2. UV-Vis spectra were recorded for the evolution of the hemoglobin’s at varying values of pH (in the range pH 4 - pH 11).
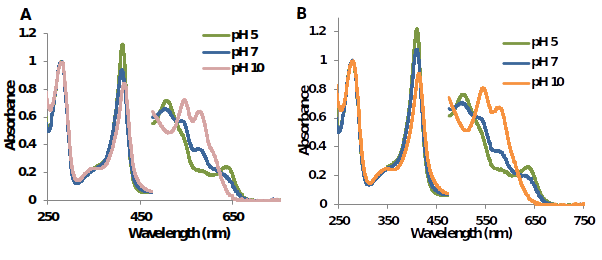
Figure 7.UV-Vis spectra of metMtHb1 and metMtHb2 in 50mM phosphate buffer at pH 5 pH 7 and pH 10. In both cases, at pH 5 predominant species is (Fe(III)-H2O); at pH 7 there is a mixture of the both species (Fe(III)-H2O) and (Fe(III)-OH); and at pH 10 predominant species is (Fe(III)-OH).
The absorbance at 580 nm was plotted at different values of pH, the graphs exhibit a sigmoidal shape (graph not shown) with inflection point which represent the value of pKa, for MtHb1 was calculated 7.34 and for MtHb2 7.50. Figure 6 shows the characteristic spectra’s of MtHb1 and MtHb2 in three different pH’s (at pH below the value for pKa - pH 5; pH close to the value of pKa - pH 7 and pH above the value of pKa - pH 10). Clearly two species are present, protonated species (Fe(III)-H2O), with molecule of water like a ligand at pH below the value of pKa of the hemoglobin and a non-protonated species (Fe(III)-OH), with hydroxide group (OH-) like a ligand at pH below the value of pKa.
Affinity for oxygen of trHb MtHb1 and MtHb2
o investigate the potential role of these two truncated Medicago trucatula hemoglobins, as oxygen carriers, we have measured the O2 binding parameters (Kd) through direct titration of the deoxy form of the proteins with various amount of oxygenated saturated water (270 µM), at room temperature (Figure 7).
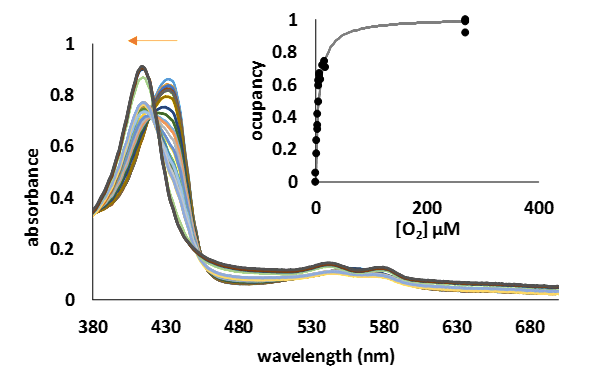
Figure 8.UV-Vis spectra of the transformation of deoxyMtHb1 (10 µM) to the oxy form by the addition step by step of various amount of oxygen. Inside: one side binding plot for MtHb1; the curve was constructed using the absorbance at 432 nm, absorbance specific for the deoxy form.
The measured Kd of 5.82 µM and 7.12 µM for MtHb1 and MtHb2, respectively (Table 1) is much lower than human hemoglobin whose role as oxygen carrier has been ascertained and significantly greater than myoglobin, and much higher than Arabidopsis thaliana’s hemoglobins. The loss of cooperativity (Hill coefficient ~1) as in the case of myoglobin and Arabidopsis thaliana hemoglobins suggests rather a role in storing oxygen rather in the transport of this molecule.
Table 1. Kd values (expressed in µM) of MtHb1 and MtHb2, compared with the Arabidopsis three hemoglobins and with human hemoglobin and myoglobin.
| K (µM) | |
|---|---|
| MtHb1 | 5.82 (±0.21) |
| MtHb2 | 7.12 (±2) |
| AtHb1 | 0.002 – 0.010 |
| AtHb2 | 0.1 – 0.15 |
| AtHb3 | 1.5 |
| Human Hb | 40 |
| Human Mb | 1.2 |
Characteristic UV-Vis spectra of ferrous and ferric hemoglobin’s (MtHb1 and MtHb2) with different ligands
The UV-Vis spectra’s of 10 μM ferrous and ferric hemoglobin’s (MtHb1 and MtHb2) with different ligands were measured in 100 mM phosphate buffer pH 7.4 in anaerobically quartz cuvettes. In the case of ferrous forms (Fe(II)-Hb), the reaction between deoxyMtHb1 (Figure 8) and deoxyMtHb2 (Figure 9) were reacted with solutions of NaN3, NaNO2, H2S, NaSO3, saturated solutions of NO and CO; and the final spectra’s are presented.
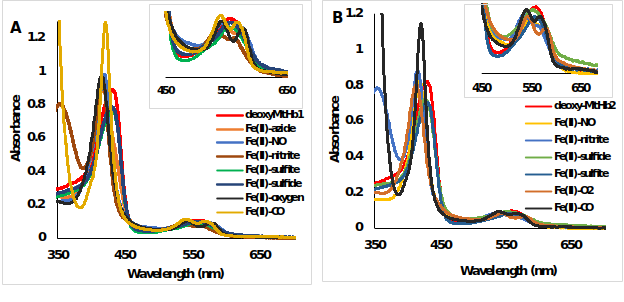
Figure 9.UV-Vis spectra of deoxyMtHb1 and deoxyMtHb2 with different ligands. Deoxy form (ferrous, Fe(II)-Hb, red line) and the adducts of the reaction between (A) deoxyMtHb1 and (B) deoxyMtHb2 with the ligands (N3-; NO; NO2-; O2; CO; S2- SO3-) recorded in 100mM phosphate buffer at pH 7.4. Note: There is no reaction between the ferrous (Fe(II)-MtHb) form of both hemoglobin’s with the ligands S2- and SO3-).
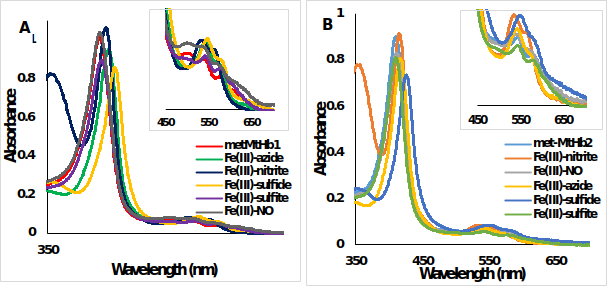
Figure 10.UV-Vis spectra of metMtHb1 and metMtHb2 with different ligands. Met form (ferric, Fe(III)-Hb, red line) and the adducts of the reaction between (A) metMtHb1 and (B) metMtHb2 with the ligands (N3-; NO; NO2-; S2- SO3-) recorded in 100 mM phosphate buffer at pH 7.4. Note: There is no reaction between the ferric (Fe(III)-Hb) form of both hemoglobin’s with the ligands NO and SO3-
Reaction of trHb (MtHb1 and MtHb2) with hydrogen peroxide (H2O2). Generation of ferrylHb (Hb-Fe4+)
The reaction between hydrogen peroxide (H2O2) and truncated hemoglobins from Medicago truncatula and Arabidopsis thaliana in contrast with mammalian hemoglobins – bovine Hb and horse heart Mb was measured using UV-Vis spectroscopy (Figure 10).
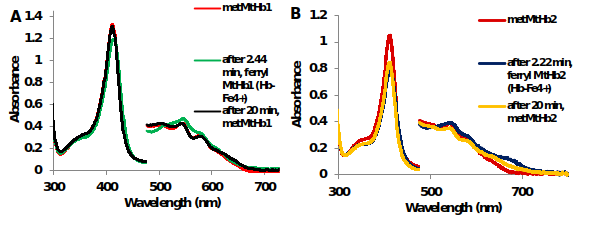
Figure 11.UV-Vis spectra of the reaction between 10μM (A) MtHb1 and (B) MtHb2 with equimolar concentration of H2O2 in 50 mM phosphate buffer at pH 7.4 and 25°C. Generation of ferrylHb (Hb-Fe4+).
The formation of the ferrylHb (Hb-Fe4+) species with 1eq H2O2 for MtHb1 and MtHb2 is fast reaction and it’s generating, for both hemoglobin’s, approximately 2 min after mixing, but it is rather unstable and is reducing to ferric ((Hb-Fe3+) form (Figure 10 and Figure 11), which is not the case for mammalian hemoglobin’s (bovine Hb and horse heart Mb).

Figure 12.Kinetic study of the reaction between H2O2 and trHb (MtHb1, MtHb2 and AtHb3). Time course of the reaction monitored at the Soret band (A) reaction between H2O2 and trHb MtHb1, MtHb2 and AtHb3; (B) reaction between H2O2 and mammalian hemoglobins – bovine Hb and horse heart Mb.
Study of the autoxidation rate of trHb (MtHB1 and MtHb2) in comparison with bovine Hb
Estimation of the autoxidation rate, t1/2 (half-life of decay) of 10 μM MtHb1 and MtHb2 in different values of pH (in the range of pH 5 to pH 11) at room temperature was done. Figure 12 shows the UV-Vis spectra of the autoxidation at pH 7.
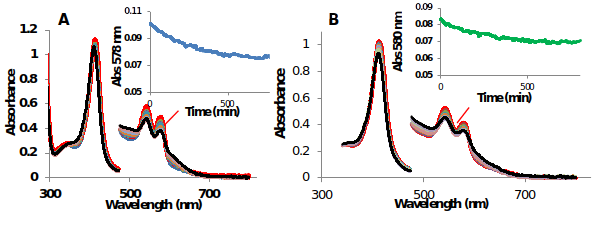
Figure 13.UV-Vis spectra of the autoxidation of oxyMtHb1 and oxyMtHb2 at pH 7 at room temperature
In both cases the autoxidation rate was accelerated in acidic pH, example in pH 5 the half-life of decay for MtHb1 was estimated 1.01 hour and 2.10 hours for MtHb2. In alkaline pH the autoxidation rate is much slower for both hemoglobin’s, at pH 10 the half-life of decay for MtHb1 was estimated 9.38 hours and 8.80 hours for MtHb2.
Evaluation of peroxidase activity of of non-symbiotic hemoglobins (MtHb1 and MtHb2)
The steady-state kinetics of peroxidase reaction catalyzed by the tr.Hbs (MtHb1, MtHb2 and AtHb3) and bovineHb was estimated by measuring the initial velocities of the oxidation of the organic substrate ABTS at various concentration of H2O2 as oxidizing substrate in 50 mM phosphate buffer at pH 7.4 and t = 25 °C. The steady-state kinetics of peroxidase activity was also measured for non-symbiotic hemoglobin’s AtHb1 and AtHb2.
The substrates ABTS (0.5 mM) and H2O2 (2 mM) were mixed with various concentrations of MtHb1, MtHb2 and AtHb3 in the range of 10-150 nM and in the range of 150-1200 nM for bovine Hb in 50 mM phosphate buffer at pH 7.4. The oxidation of ABTS catalyzed by the plant hemoglobin’s was monitored by the increase of absorbance at 420 nm. No increase of A420 nm was detected without the addition of the hemoglobin’s (Figure 13).
The trHb MtHb1, MtHb2 and AtHb3 possess very strong peroxidase activity, catalytic efficiency with value of 3.75 x 10³ M-1s-1; 4.42 x 10³ M-1s-1 and 1.43 x 10⁴ M-1s-1 respectively; values that are comparable to the peroxidase activity of HRP 4.4 x 10⁵ M-1 s-1. The nsHb AtHb1 and AtHb2 exhibited very weak peroxidase activity (catalytic efficiency) of 571.26 M-1 s-1 and 24.50 M-1 s-1 respectively comparable to bovine Hb 128.34 M-1 s-1. These results suggest that in vivo it’s possible that one of the functions of the trHb may be to act as peroxidases and influence the plant physiology by modulating the levels of H2O2, which is not the case for the other nsHb, AtHb1 and AtHb2.
The pH dependence of the peroxidase activity was investigated in the range of pH 4.5 to 9. The three trHb showed maximum peroxidase activity in pH 6 and linear relationship in the range of pH 6 to pH 8. The nsHb AtHb1 and AtHb2 exhibited the well-known bell-shaped pH dependence with optimum at pH 7. BovineHb showed maximum peroxidase activity in pH 5 and linear dependence of the initial velocities in the range of pH 5 to pH8 (graphs not shown).
Nitrite reductase activity of non-symbiotic hemoglobins (MtHb1 and MtHb2) from Medicago truncatul
Nitrite reductase activity was studied under anaerobic conditions using 10μM of each hemoglobin (MtHb1 and MtHb2) and deoxygenated solution of NaNO2 in the concentration range 0.05 - 1 mM in 100 mM phosphate buffer at pH 7.4 and t = 25°C and the second order bimolecular rate constant (k)/M-1 s-1 was calculated. Figure 10 shows the reaction between the deoxy forms of the hemoglobin’s with 0.5 mM nitrite at pH 7.4.
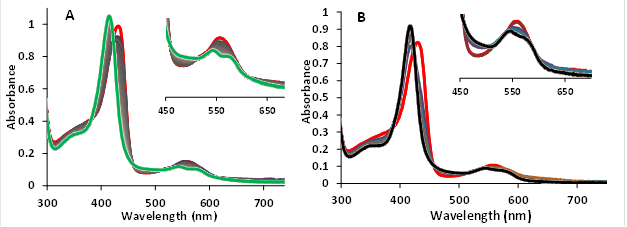
Figure 15.The reaction between nitrite and deoxyhemoglobins MtHb1 and MtHb2. (A) UV-Vis spectra of deoxyMtHb1 during oxidation by 0.5 mM nitrite in 100 mM phosphate buffer at pH 7.4 and 25°C. (B) UV-Vis spectra of deoxyMtHb2 during oxidation by 0.5 mM under the same conditions.
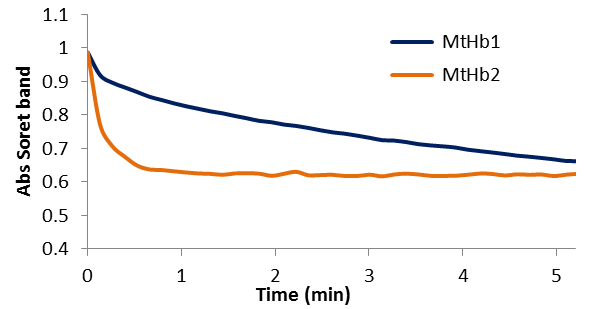
Figure 16.A comparison between kinetic of the reactions between deoxyMtHb1 and deixyMtHb2 with 0.5 mM nitrite in 100 mM phosphate buffer pH 7.4 and 25°C.
Figure 15 shows the exponential decay of the absorbance of the Soret band characteristic for the deoxy forms (433nm for MtHb1 and 431 nm for MtHb2). The reactions were recorded using 10μM from the protein and 0.5 mM nitrite in pH 7.4. The reaction between nitrite and deoxyhemoglobins (HbFe2+) generates methemoglobin (HbFe3+) and ferrous nitrosylHb (HbFe2+-NO) through the intermediacy of nitric oxide (NO).
In the case of the reaction between deoxyMtHb2 and nitrite the kinetic of the reaction and the transformation towards nitrosylhemoglobin (HbFe2+-NO) is much faster. The second order bimolecular rate constant were determined (4.82 M-1 s-1 for MtHb1 and 181.77 M-1 s-1 for MtHb2) using the linear plot of the observed rate constants (kobs/min-1) versus nitrite concentration obtained in 100 mM phosphate buffer pH 7.4 and 25°C. The nitrite reductase activity was also measured for the three non-symbiotic hemoglobin’s from the plant model Arabidopsis thaliana (AtHb1, AtHb2 and AtHb3, one representative from each class) and mammalian globin, horse myoglobin (Mb), for comparison. It was determined that the second order bimolecular rate constant were (67.56 M-1 s-1 for AtHb1; 36.62 M-1 s-1 for AtHb2; 19.09 M-1 s-1 for AtHb3 and 7.95 for Mb).
The reaction of NO with deoxyMtHb1 and deoxyMtHb2
Non-symbiotic hemoglobin’s (nsHbs) influences cell signaling and metabolism by modulating NO level, a molecule often produced in hypoxic conditions.
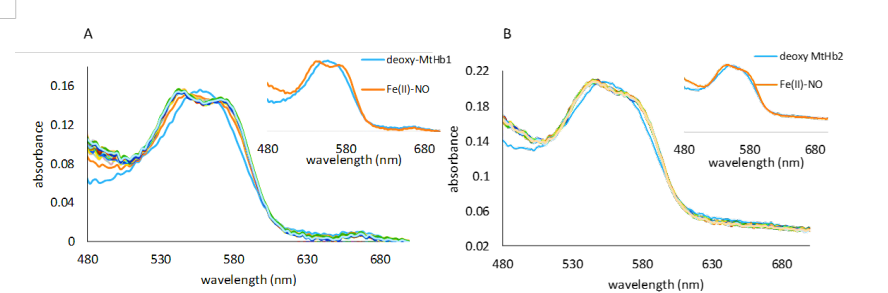
Figure 17.UV-vis spectra collected upon mixing deoxy MtHb1 (A) and deoxy MtHb2 (B) with 933 and 595 µM NO respectively. The spectra were collected in a stopped-flow time scale (2 s), in 100 mM phosphate buffer, pH 7.4. The anaerobical conditions were kept by using protocatechuic acid/protocatechuate dioxygenase system (0.4 mM PCA, 0.13 µM PCD, respectively). Inside: the first and final spectrum of this reaction correspondent to deoxy-MtHb1 and nitrosyl complexes.
Treatment of deoxy-MtHbs with NO resulted in a new absorbtion spectrum with the maximum in the α and β region at 544 and 546 nm, corresponding to the iron-nitrosyl hemoglobin (Hb-NO), the same product resulted in the reaction of deoxy-Hb with nitrite.
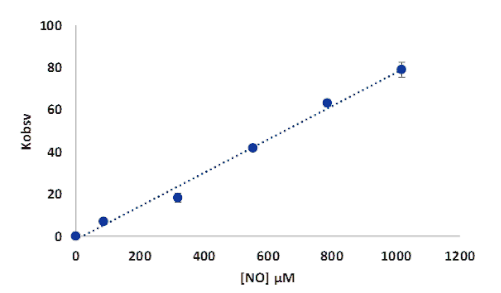
Figure 18.Plots of kobs versus NO concentration for the reaction of deoxy-MtHb1 with NO, pH 7.4. The conditions of the reaction were detailed in Figure 16.
The rate of the reaction of deoxy-MtHb1 with NO, determined based on the graph from Figure 17, was found to be 6.4 x 10⁴ M-1s-1, slower than those observed for human hemoglobin which is in a range of 107 M-1s-1 or for Arabidopsis thaliana hemoglobin, class 1, where is of 108 M-1s-1. For MtHb2 the rate of reaction between deoxy-MtHb2 with NO could not be determined, due to the narrow concentration range where the reaction can be studied.
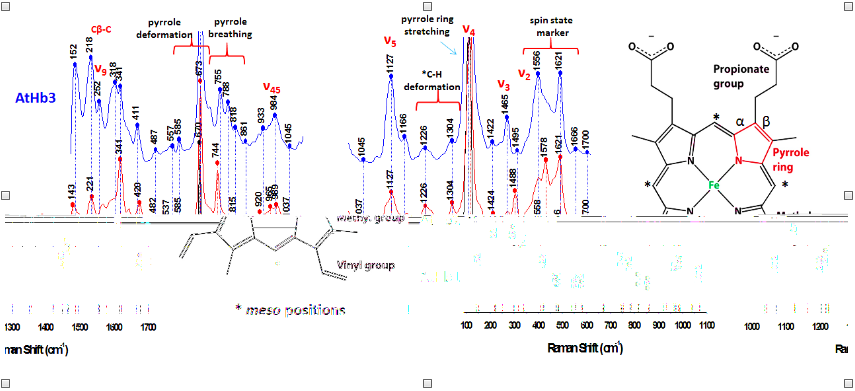
Figure 19.Raman spectra of Arabidopsis thaliana plant hemoflobins, in deoxy form
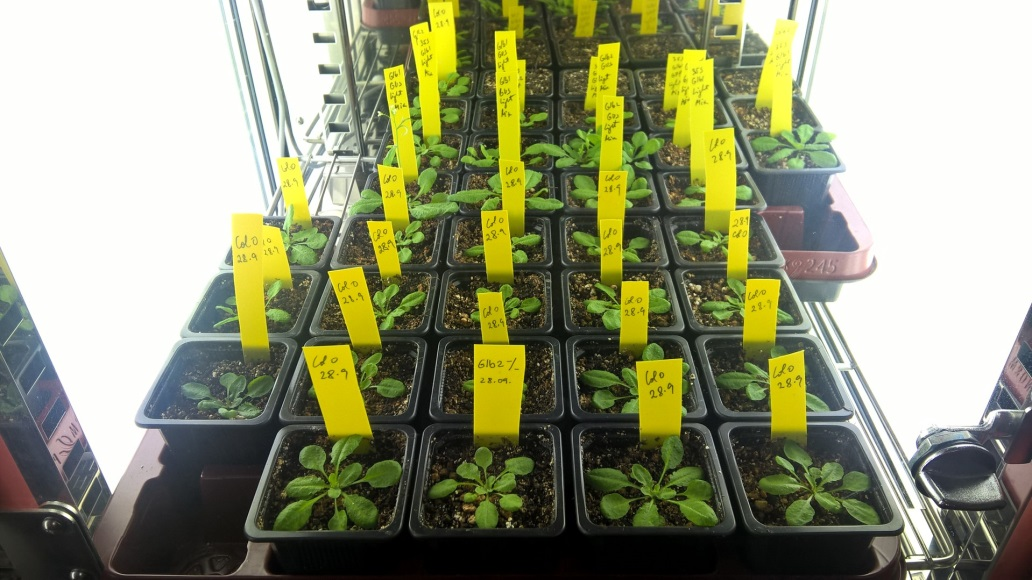
Figure 20.Perspective pictures of the plant grow chambers in our lab, purchased from the project funds, recently established.
The oxidation of Arabidopsis thaliana and Medicago truncatula hemoglobins by quercetyl radical
AtHb1 is more susceptible of oxidation by quercetyl radical than AtHb2 but less than hemoglobin, myoglobin and cytochrome c. Quercetyl radical was obtain my mixing 2.5 µM quercetine with 17 nM laccase, in acetate buffer 50 mM, pH 6. The concentration of proteins was 20 µM and the reaction was monitored in time, at the β band of the protein.
Table 1. The half time for the oxidation of AtHb1 and AtHb2 in the presence of quercetyl radical compared with hemoglobin, myoglobin and cytochrome c
| Protein | t1/2 (min) |
|---|---|
| Hb | 54.71 |
| Hb+ quercetyl | 4.66 |
| Mb | 16.16 |
| Mb + quercetyl | 4.96 |
| cyt c | 47.31 |
| cyt c + quercety | 3.39 |
| AtHb1 | 27.03 |
| AtHb1 + quercetyl | 10.42 |
| AtHb2 | 4.00 |
| AtHb2 + quercetyl | 2.49 |
In the case of the truncated hemoglobins MtHb, MtHb2 and AtHb3, 25µM of each protein was oxidized quercetyl radical which was generated by mixing 7.5µM quercetine with 5µM laccase in 50mM acetate buffer, pH 6. The kinetic of the reaction in time is shown in Fig.22 and the half time of the reaction is given in Table2. For comparison under the same conditions the experiment was done for bovine Hb, myoglobin and cytochrome c, Fig.23.
Table 2. The half time for the oxidation of truncated Hbs in the presence of 7.5µM quercetine and 5µM laccase, pH6.
| t1/2 (min) | error | |
|---|---|---|
| MtHb1 | 0.68064 | 0.01689 |
| MtHb2 | 1.05737 | 0.03061 |
| AtHb3 | 0.22302 | 0.01906 |
The oxidation of MtHb1 by quercetyl radical under these conditions is faster than MtHb2, but around three times slower than the oxidation of AtHb3. All truncated hemoglobins are more prone to oxidation by quercetyl radical than bovine Hb, myoglobin and cytochrome c.
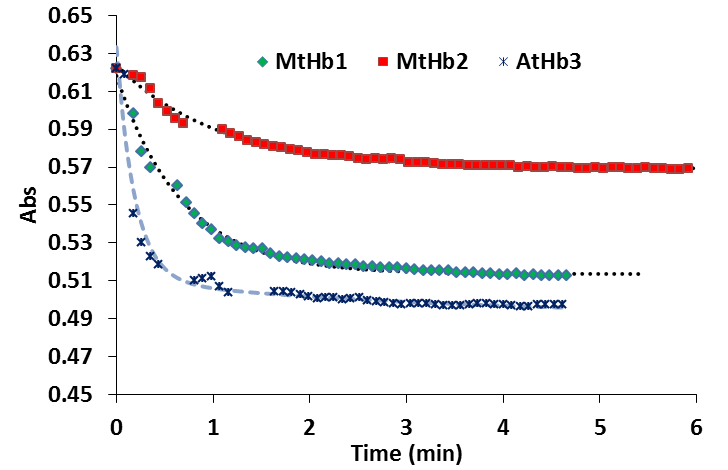
Figure 22.Time course of the reaction between 25µM (MtHb1, MtHb2 and AtHb3), 7.5µM quercetine and 5µM laccase in 50mM acetate buffer, pH 6.
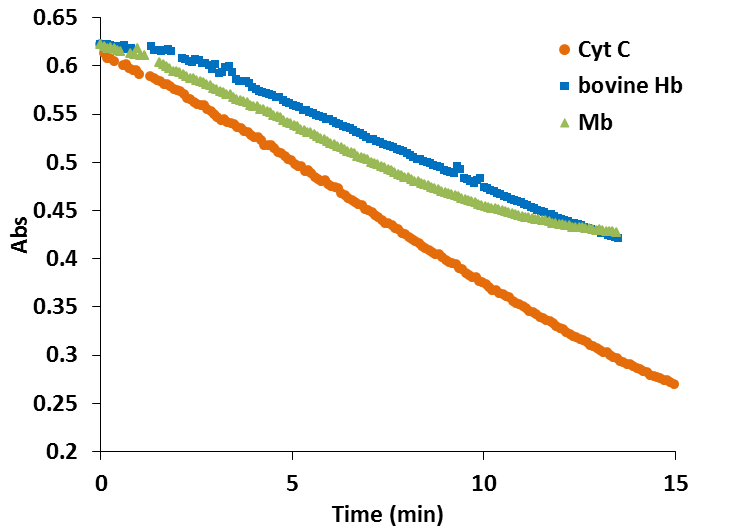
Figure 23.Time course of the reaction between 25µM (bovine Hb, myoglobin and cytochrome c), 7.5µM quercetine and 5µM laccase in 50mM acetate buffer, pH 6.
Comparative analysis of several phenolic compounds for their ability to reduce ferryl forms of three non-symbiotic Hbs (AtHb1, AtHb2 and AtHb3)
Thirteen phenolic compounds (quercetin, rutin, isoquercitrin, caffeic acid, ferulic acid, p-coumaric acid, vanillic acid, luteolin, apigenin, (+)-catechin, (-)-epicatechin, aesculetin, and resveratrol) were analyzed and their reducing powers towards the three different classes ferryl phytoglobins from Arabidopsis thaliana were investigated. The ferryl species of the studied Hbs were generated in situ by hydrogen peroxide oxidation of the ferric form. The kinetic profiles of the phenolic compounds oxidation were monitored. The results from this study are already published (article: PROBING REDUCING POWER FOR FERRYL PHYTOGLOBINS OF SEVERAL PHENOLIC COMPOUNDS USING THEIR KINETIC PROFILES ASSISTED BY CHEMOMETRIC METHODS).
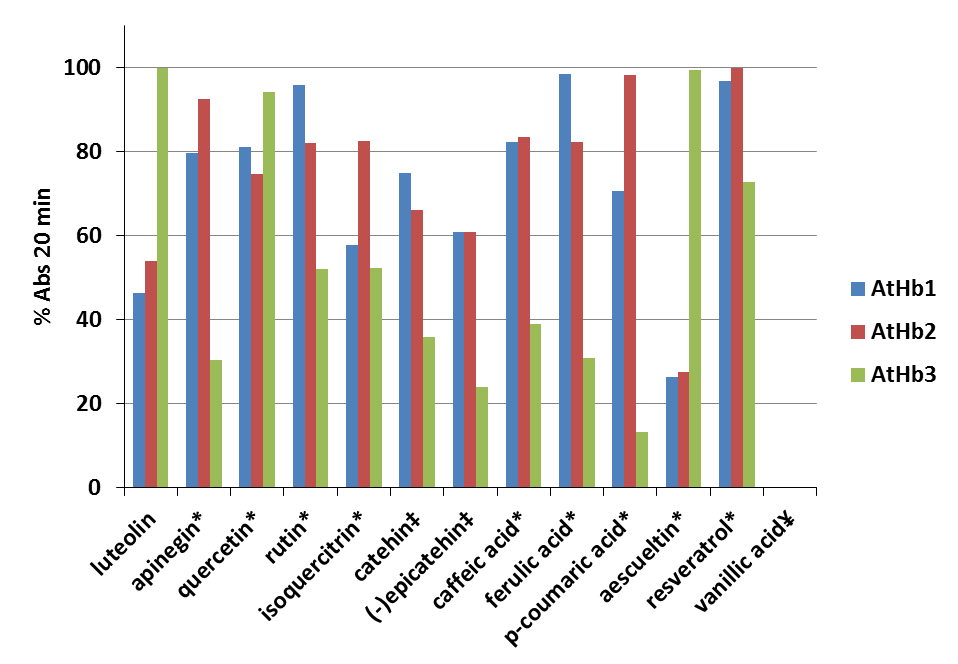
Figure 24.Percentage of oxidized phenolic compounds monitored at the λ max in presence of metAtHb1, metAtHb2 and metAtHb3 after 20 min reaction time (error bars represent standard deviations of the mean). The reaction was fitted using Michaelis–Menten kinetics (one site binding) in Origin 6.1 * % Abs after 20 min from the initial exponential decay ‡ % Abs after 20 min in direction of increasing of the absorbance due to formation of the radical. ¥No reaction between VA with any of the three plant hemoglobins under this condition
On Fig. 24 is shown the percentage of oxidized phenolic compounds after reaction time of 20 min in 50 mM phosphate buffer, pH 7.4 and temperature of 25°C. For this purpose it was used 0.1 mM of each phenolic substrate and 2 μM AtHb1 or 2 μM AtHb2 followed by adding of 1 mM H2O2. The reaction was monitored by continuously acquiring UV-Vis spectra between 200 and 800 nm. In the case of AtHb3 it was used 1 μM AtHb3 mixed with 0.5 mM H2O2.
Therefore, the studied Hbs served as enzymes used in catalytic amounts that oxidized the phenolic compounds. The three phytoglobins have different kinetics profiles and mechanism.
Reaction of oxy-AtHb3 with the phenolic compounds (quercetin, rutin, luteolin, p-coumaric acid and caffeic acid)
Interestingly, from all Arabidopisis thaliana and Medicago truncatula hemoglobin only AtHb3 reacts directly with the phenolic compounds. The reaction consists in the transformation from the oxy to met form, as it shown in Figure 25, A. The oxidation of AtHb3 was monitored by the decrease in absorbance at 543 nm; the rate depends on the concentration of the phenolic compound (Figure 4 B).
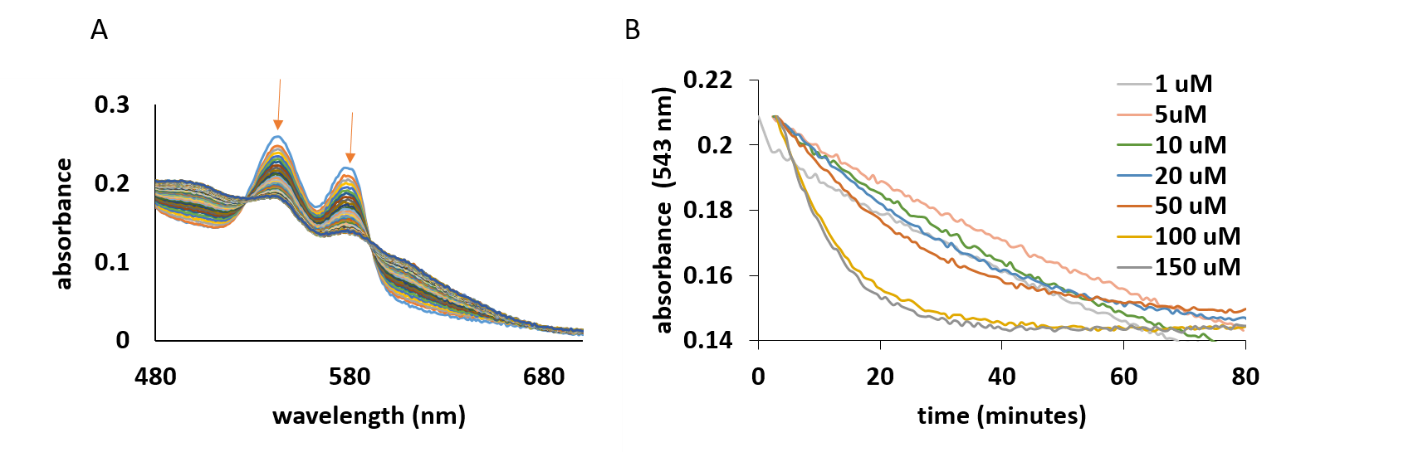
Figure 25.A) UV-vis spectra of the α and β bands of 20 µM of AtHb3 mixed with 200 µM caffeic acid, in 50 nM acetate buffer, pH 5.5. B) Time course of the reaction between AtHb3 (20 µM) and various concentrations of caffeic acid shown in legend, monitored at 543 nm, in 50 mM acetate buffer, pH 5.5.
The steady-state kinetics of this reaction were estimated by measuring the initial velocities of the oxidation of the oxy-AtHb3, in the presence of nano and µmolar amount of polyphenols, in 50 mM acetate buffer, pH 5.5, at room temperature. Figure 26 shows that luteolin and rutin react at a high rate with AtHb3, caffeic acid has an intermediate rate and p-coumaric acid reacts very slowly with AtHb3.
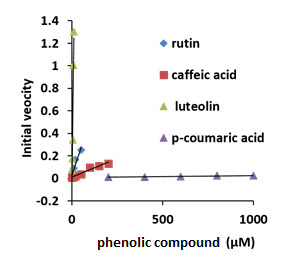
Figure 26.Plots of the initial velocities of 20 µM concentration of AtHb3 monitored at 543 nM in the presence of rutin, caffeic acid, luteolin and p-coumaric acid, in 50 mM acetate buffer, at pH 5.5, at room temperature.
In the case of quercetin, it could be estimated a constant binding (Kd) of 2.69 µM as is shown in Figure 27.
Figure 27.The changes in absorbance of AtHb3 monitored at 543 nm in the presence of various concentration of quercetin, measured in 50 mM acetate buffer, pH 5.5.
Liposomes oxidation induced by Arabidopsis thaliana (AtHb1, AtHb2 and AtHb3) and Medicago truncatula (MtHb1 and MtHb2) hemoglobins
It is known that hem proteins can induced lipid oxidation in a liposomes system through generation of the high valent form of the iron, ferryl. Here, it was studied the capacity of plant hemoglobin to induce lipid oxidation in a manner very similar with the well-studied protein hemoglobin, myoglobin and cytochrome c. Thus, the induction time reflected in the lag phase of the reaction was higher for AtHb3 and MtHb1 than of the others proteins. AtHb2 has a very short lag phase but interestingly this protein can generate the highest quantities of oxidized lipids. AtHb1 and MtHb2 have a lag phase very close to myoglobin and cytochrome c, respectively (Fig.28).
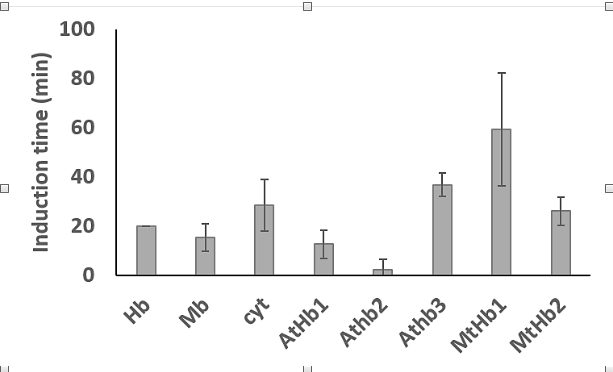
Figure 28.The lag phase of the oxidation of lipids by Arabidopsis thaliana and Medicago truncatula hemoglobins compared with animal hemoglobin, myoglobin and cytochrome c.
The experiment was conducted at room temperature, in phosphate buffer, 20 mM, at pH 7. The liposomes were obtained by sonication of soybean lecithin (5 mg/ml) dissolved in phosphate, during 15 minutes. The experiment was trigged by the addition of 2 µM hem proteins and the reaction was monitored at 280 nm were the lipids oxidized absorbs.
Determination of the extinction coefficient of Arabidopsis thaliana hemoglobins
The extinction coefficients of the Soret, α and β bands were determined by UV-vis spectroscopy using the method of quantification of the heme using 0.2 M NaOH and 5 % triton X-100. The heme realized in the solution was quantified using a calibration curve made for myoglobin. The extinction coefficient determined at the Soret band at pH 7.4 for the oxy AtHb1 is 150 mM-1 cm-1 at 415 nm, for the met AtHb1 is 133 mM-1 cm-1 at 413 nm and for deoxy AtHb1 is 140 mM-1 cm-1 at 426 nm; for oxy AtHb2 at 412 nm, ε = 140 mM-1 cm-1, metAtHb2 at 411 nm, ε = 127 mM-1 cm-1, deoxy at 425 nm, ε = 212 mM-1 cm-1; for oxy AtHb3 at 418 nm, ε = 120 mM-1 cm-1, met AtHb3 at 413 nm, , ε = 116 mM-1 cm-1, deoxy AtHb3 at 433 nM, ε = 101 mM-1 cm-1. The extinction coefficient were also determined for the α and β bands of this three plant hemoglobin (data not shown).
Studies of the autoxidation rate of Arabidopsis thaliana hemoglobins
The autoxidation rates of these three Arabidopsis hemoglobin were studies in universal buffer, at room temperature from pH 5 to pH 12.
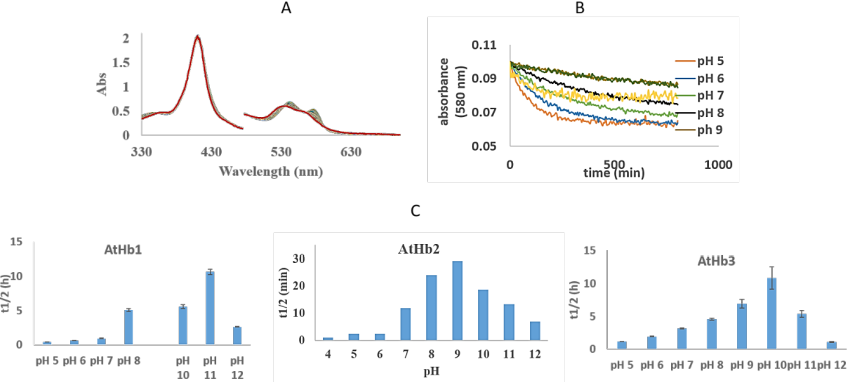
Figure 29.A) UV-vis spectra of the autoxidation rates of AtHb2, at pH 7; B) Time course of the absorbance at 580 nm for AtHb3 autoxidation in different pH; C. Half-life times pH dependency of 8 µM oxy- AtHb1, AtHb2 and AtHb3, in universal buffer (H3BO3, monosodium citrate C6H7NaO7, TAPS, Na2HPO4), at room temperature.
Estimation of autoxidation rates, t1/2 (half-life of decay) calculated from the kinetic of the reaction at the β bands of protein (Figure 29, B) is given in the Figure 29, C and shows a parabolic dependence of pH in all three cases. AtHb2 shows the highest autoxidation rates compared with AtHb1 and AtHb2.
The autoxidation reaction was studied in the presence of ascorbate, glutathione and NaDH (Figure 30). These antioxidants promote the autoxidation in a different way. NADH is the most accelerating agent influencing the autoxidation rates of all three type of hemoglobins in this order AtHb3>AtHb2>AtHb1, while ascorbate can enhance very efficiently only the autoxidation rates of AtHb3 even at low concentration. Glutathione has a little effect only in the case of AtHb2 (Figure 30, B).
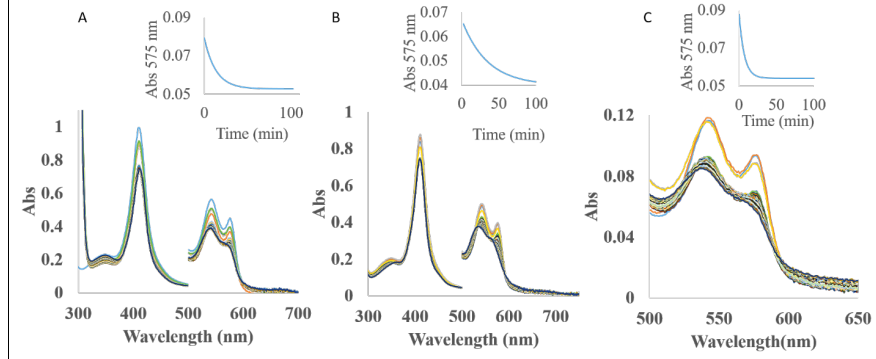
Figure 30.A) UV-vis spectra of AtHb2 in the presence of 10 mM ascorbate, pH 7.5; B) UV-vis spectra of AtHb2 in the presence of 10 mM glutathione, pH 7.5. C) UV-vis spectra of AtHb2 in the presence of 10 mM NaDH, pH 7.5. Inside: the course of absorbance at 575 nm during the autooxidation rate for all these three cases.
It was tested the influence of anions (Cl-, Na-, SCN-) upon the autoxidation rates of plant hemoglobin compared with animal hemoglobin and myoglobin. AtHb2 is the most susceptible to autoxidation in the presence of each anion tested, SCN- being the most powerful prooxidant agent (Figure 31). In the case of AtHb1 and AtHB2 only SCN- has a little effect on the autoxidation rates, the others anions have, by contrary, an opposite effect reflected in the stabilization of protein towards autoxidation. For animal’s protein, the effect of these anions is correlated with their nuclofilicity: SCN- > F- > Cl-.
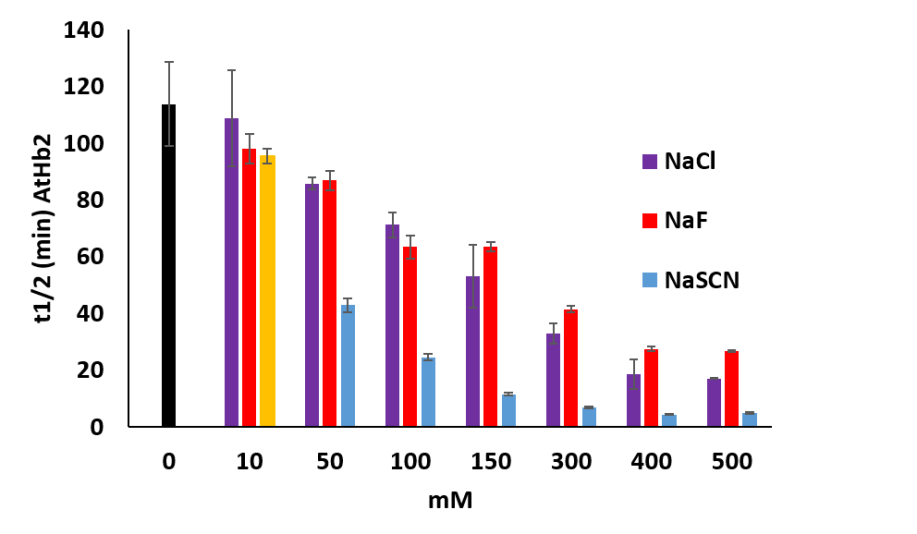
Figure 31.Half life time of the autoxidation rates of AtHb2 (8 µM) in the presence of NaF, NaCl and NaSCN at the concentration shown in the figure. The black bars represent the control sample: proteins without anions.
Reduction reactions for Arabidopsis thaliana hemoglobins
All three Arabidopsis hemoglobin can be reduced by milimolar concentration of ascorbate, but only AtHb1 and AtHb3 can be reduced by glutathione and NADH in the same range. AtHb3 is very sensitive to NaDH and glutathione which at high concentration (30 mM) can destroy the protein. We concluded that this compound cannot act as reducing agents in vivo due to their little amount in which they are found in plant.
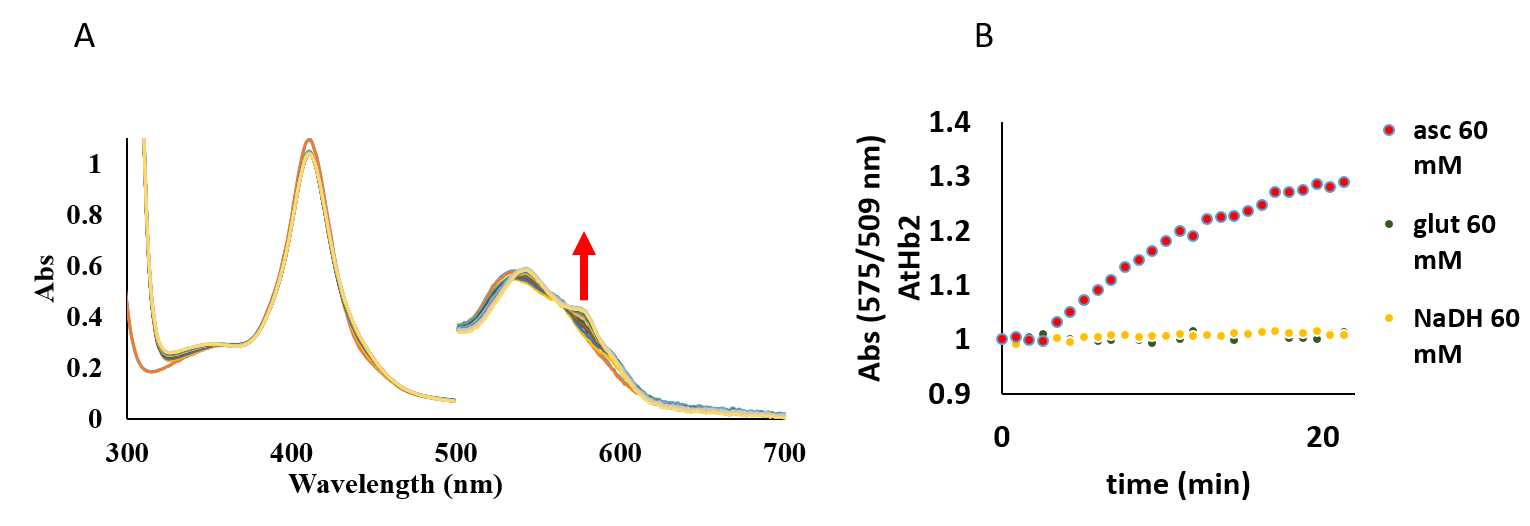
Figure 32.A) Reduction of AtHb2 from Fe3+ to Fe2+ in the presence of 20 mM ascorbate. B) Met form reduction of AtHb2 (8 µM) defined by the specific growth in absorbance in the presence of ascorbate, gluthatione and NaDH, in phosphate 100 mM, pH 7.
In figure 33 it was shown that A. thaliana extract contains a reductase that can reduced the met form of AtHb2.
Figure 33.Right: UV-vis spectra for the reduction of met AtHb2 to oxy AtHb2 in the presence of leaves extract and 1 mM NaDH. Left: A. thaliana leaves extract.
Figure 34 shows that AtHb2 can be reduced by human erythrocytes in a short time suggesting that membrane erythrocytes have a methemoglobin reductase activity for plant hemoglobins.
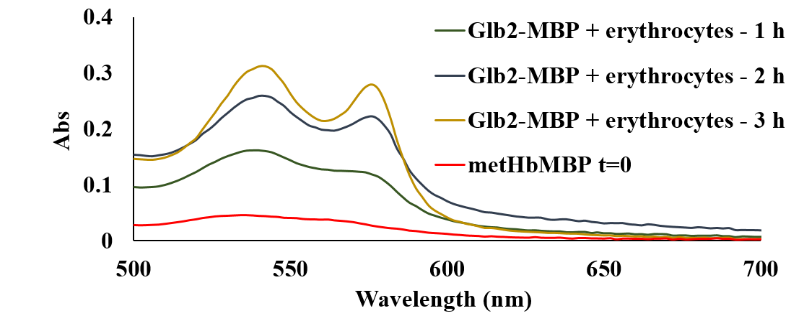
Figure 34.Reduction of AtHb2 in the presence of red blood cells at 37°C
Determination of reduction potential of the nsHb (AtHb1, AtHb2 and AtHb3).
Redox titrations of the nsHb (AtHb1, AtHb2 and AtHb3) were performed in the range of pH 5-10 in 3 mL anaerobic quartz cuvette at 25°C under an argon atmosphere. (see Fig. 35).
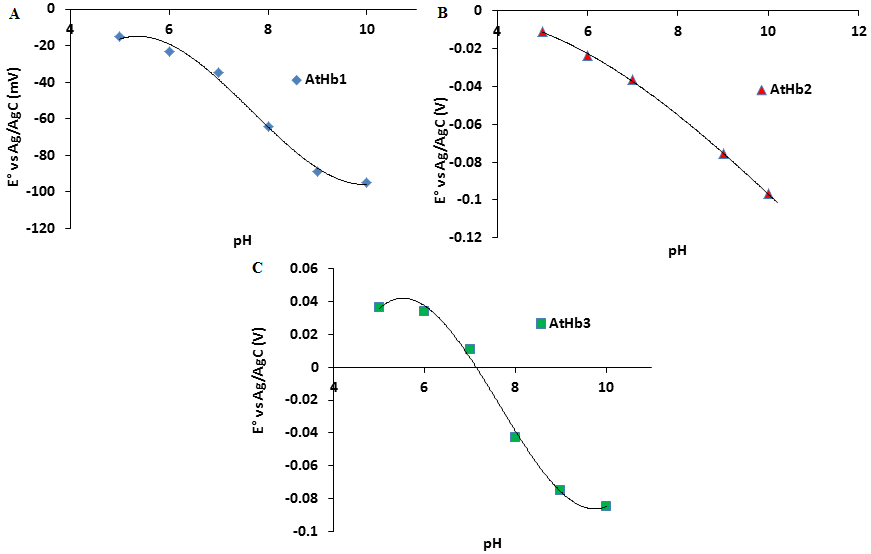
Figure 35.Dependence of standard reduction potential versus pH for A) AtHb1 B) AtHb2 and C) AtHb3.
The titration was done towards reductive direction in deoxygenated 100 mM three component buffer using 5mM dithionite. The electrical communication was enhanced using 6 mediators with concentration 0.001mM.
AtHb1 and AtHb2 exhibit very similar redox potentials, with negative value of the midpoint redox potential at all pH, but AtHb3 was found to have more positive values at all measured pH (pH5-10) in comparison to AtHb1 and AtHb2. At acidic and neutral pH AtHb3 is more easily reduced than AtHb1 and AtHb2, probably due to its pentacoordination structure.
Abiotic stress
Two basic water stress test were performed on 4 mutants (HgGlb1 and Glb2% -knokcdown on the gene for AtHb1 and AtHb2 production, respectively; 35SGlb1 and 35SGlb2-overexpression on the gene for AtHb1 and AtHb2 production, respectively) and plus the wild type Col0.
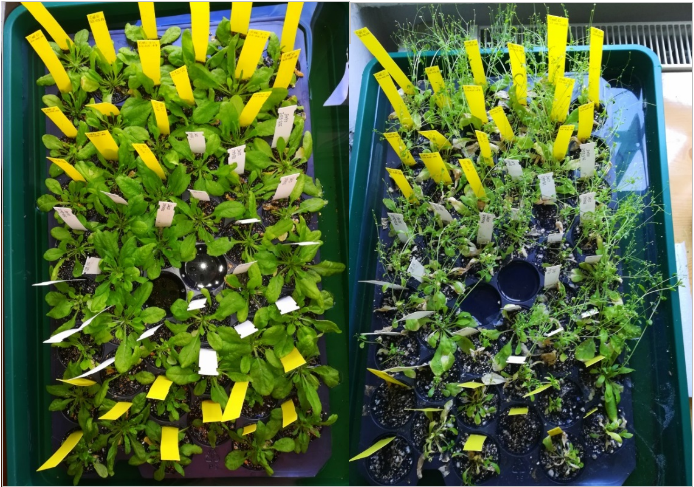
Figure 36.The five Arabidopsis thalian plants on the left the first day, on the right after 30 days soil submersion under water.
The first weter stress was done by compleletly submersed the soil, practicaly the roots, in water during the experiment (see Fig.36) The experiment was started after the plants were fully grown and developed, before the submersion the flowers and the steams where removed. The plants were exposed to water stress (excess of water) for 30 days (see Fig.37 and Fig.38) and after the length of the new grown steam was measured, the results are shown in Table 3.
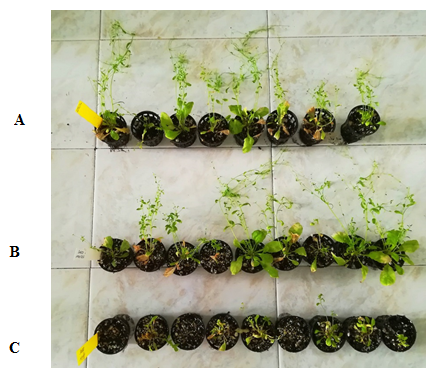
Figure 37.Comparison of A) Col0 B) 35SGlb1 C) HgGlb1 after the soil was submersed in water for 30 days.
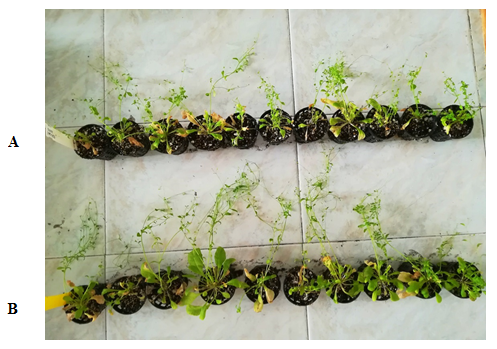
Figure 38.Comparison of A) 35SGlb2 B) Glb2% C) HgGlb1 after the soil was submersed in water for 30 days.
As we can see that the knockdown mutant HgGlb1 suffered the most, which is not the case for the overexpressed line 35SGlb1 of the same gene. This means that that AtHb1 (phytoglobin from class 1) probably is involved in water stress defense mechanisms.
Table 3. The length of the steam (cm) after the excess water stress in the period from 11.07.2017 to 09.08.2017
| No. of plant | HgGlb1/cm | 35SGlb1/cm | 35SGlb2/cm | Glb2%/cm | Col0/cm |
|---|---|---|---|---|---|
| 1 | 0.5 | 23.5 | 7 | 10 | 19 |
| 2 | 0.5 | 19 | 8 | 17 | 13 |
| 3 | 6.5 | 5 | 11 | 20 | 23 |
| 4 | 0 | 17 | 16 | 24.5 | 28 |
| 5 | 5 | 27 | 20 | 10 | 15 |
| 6 | 1.5 | 4.5 | 10 | 19 | 21.5 |
| 7 | 0 | 11 | 7 | 30 | 5 |
| 8 | 3 | 14.5 | 20 | 25 | 30 |
| 9 | 0 | 7 | 14 | 4 | |
| 10 | 16 | 18 | |||
| 11 | 8 | ||||
| average: | 1.89 | 14.28 | 12.45 | 17.75 | 19.31 |
The second water stress experiment was done in the absence of water during the period meaning that the plants were expose to drought.
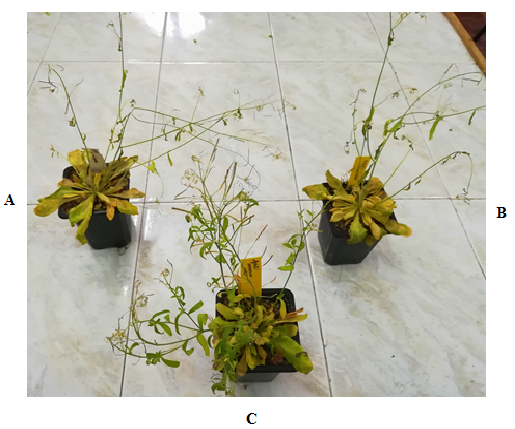
Figure 39.Comparison of A) Col0 B) Glb2% C) HgGlb1 after 23 days of drought.
The plants were exposed to drought after the steams and the flowers were developed, so the water strees with drought was performed during the period of plant flowering for a period of 23 days.
On Fig. 40 and Fig. 41 is shown upclose the state of the leaves of the Arabidopsis thaliana plants after the drought period, the steams with the flowers were remove before taking the photos for better assestment. The knokdown mutant HgGlb1 was the less from the drought.
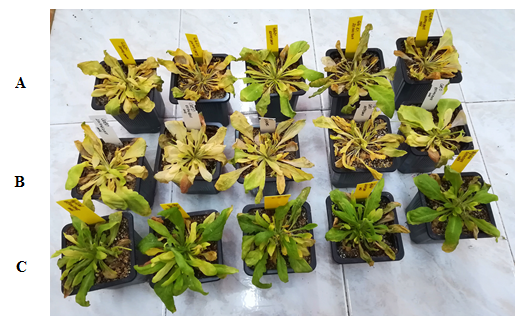
Figure 40.Comparison between (A) 35SGlb2 (B) 35SGlb1 after the drought period.
28.10.2017, Cluj-Napoca
Lect. Dr. Augustin C. Mot